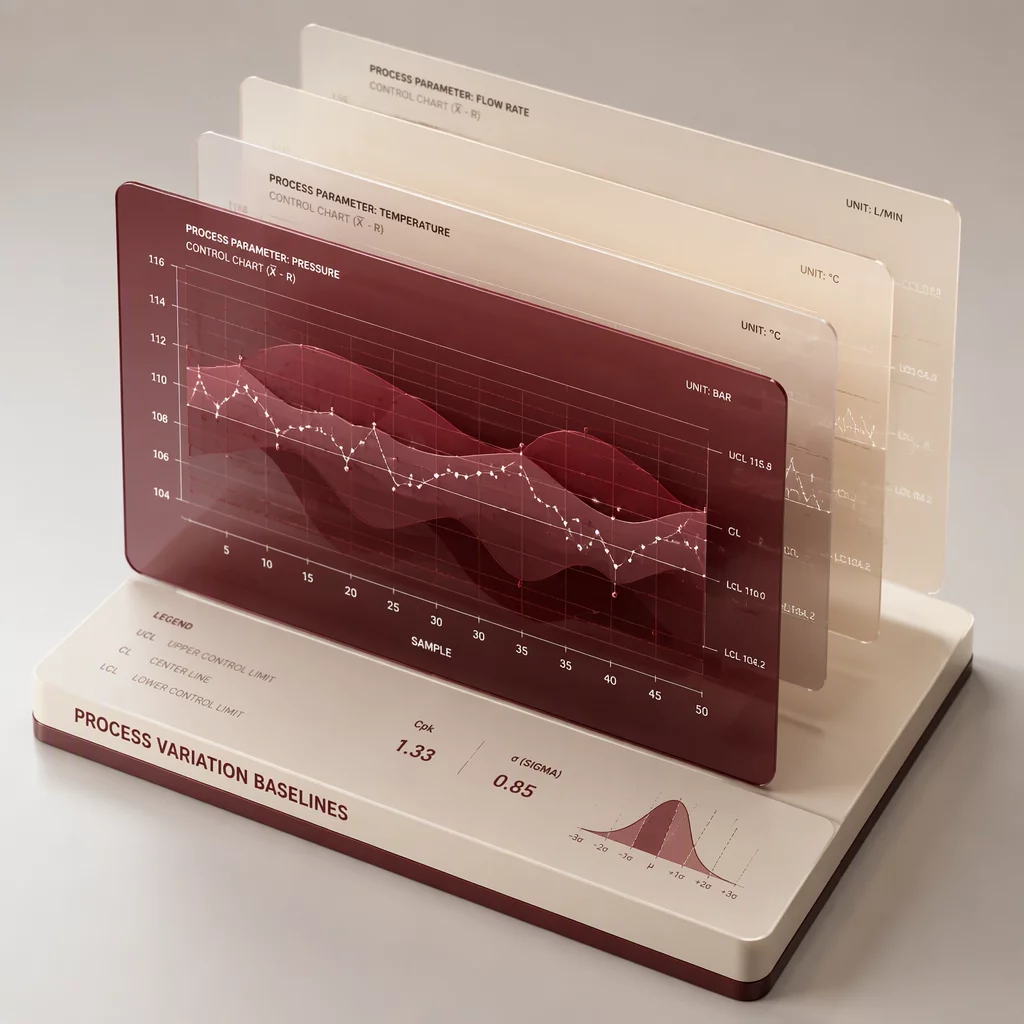
Variance & Baseline Inquiries
Explore standard operational protocols for establishing baseline calculation intervals, distinguishing common-cause noise from assignable causes, and sustaining statistical process discipline.
In standard statistical quality engineering, an initial baseline requires at least 20 to 25 rational subgroups with subgroup sizes between 4 and 5 units (totaling 80 to 125 individual consecutive observations). When monitoring individual measurements (I-MR charts), a span of 30 or more sequential units without major system disruptions is necessary to calculate reliable temporary limits.
Freezing limits prematurely on fewer than 20 subgroups inflates sampling error, yielding artificial limit boundaries that trigger excessive false alarms.
Limits must be recalculated only when a verified, deliberate change occurs in the underlying system—such as tooling redesign, raw material specification upgrades, or permanent mechanical adjustments. Routine variations, seasonal shifts, or single isolated outliers must never prompt limit recalculations.
Continual recalculation without engineering changes effectively masks deterioration, transforming chronic instability into normalized operational standards.
Statistical stability assesses whether a system exhibits predictable behavior driven entirely by common-cause variance, evaluated via control charts. Capability evaluates whether that predictable behavior conforms to customer engineering tolerances (specifications).
A system can be highly stable yet totally incapable of meeting tight tolerances. Conversely, computing capability metrics (such as capability indices) on an unstable process yields meaningless metrics because future performance cannot be predicted.
The standard primary indicators include:
- Point beyond 3-sigma: A single observation falling outside upper or lower control limits.
- Zone run: Nine consecutive points on one side of the historical centerline.
- Drift/Trend: Six consecutive points steadily increasing or steadily decreasing.
- Stratification: Fourteen consecutive points alternating continuously up and down.
When any of these conditions are met, statistical stability is breached, signaling an active assignable disturbance.
Process tampering (often demonstrated by the classic Funnel Experiment) occurs when operators treat common-cause variance as if it were a special cause by tweaking machine settings after individual measurements drift slightly from the target.
Reacting to random baseline noise injects secondary external variance into the equipment, doubling or tripling overall dispersion and widening the natural control envelope over time.
When implementing planned technological or operational upgrades, maintain a distinct vertical stage divider on control charts. Stage 1 presents the baseline historical performance, while Stage 2 establishes a new preliminary monitoring period.
Do not pool data across the transition boundary. Keep calculations segregated until Stage 2 achieves at least 20 stable subgroups under the revised operating protocol.
A rational subgroup is structured so that variation within a single subgroup represents only inherent random noise (common causes), while variation between different subgroups exposes potential assignable shifts over time.
Collecting units produced consecutively in rapid succession (e.g., 5 sequential pieces every hour) preserves this structure. Mixing parts from multiple tooling heads or distinct operators inside one subgroup destroys chart sensitivity.
Use Xbar-R (or Xbar-S) when parts are produced rapidly and rational grouping of multiple items is technically logical and cost-effective. These charts benefit from the Central Limit Theorem, providing robustness against non-normal distributions.
Deploy I-MR charts when measurements are collected individually at long intervals, testing is destructive, or batch homogeneity makes multiple samples redundant. For deeper software implementation steps, refer to our Minitab analysis guide.
No matching questions found
Try modifying your search terms or select another category filter above.
Need custom baseline parameters for complex machinery?
Review our comprehensive Knowledge Base or consult our engineering team for methodology reviews.