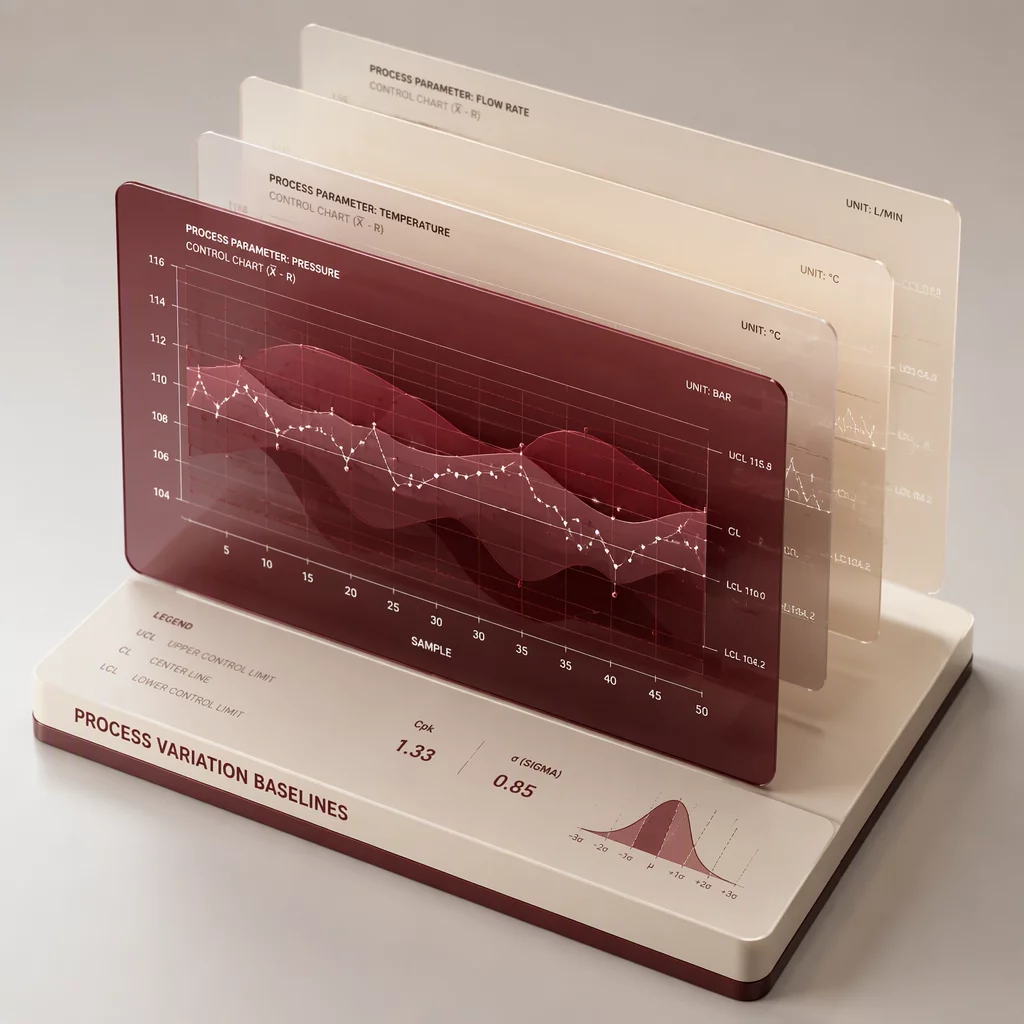
A Process Change Happened Between Two Control-Chart Windows
Examine how time-ordered observations shift across operational milestones, and why statistical calculations require direct operational context to guide meaningful diagnosis.
Baseline Data Collection (Subgroups 1 to 25)
Measurements recorded during normal operating parameters show routine common-cause dispersion around the initial center line. All consecutive points remain bounded between baseline limits without runs, trends, or zone breaches.
Initial takeaway: Baseline readings demonstrate predictable common-cause variation under standard routine operation.
Minitab Control Chart Generation
When plotting the Xbar-R chart in Minitab using Phase 1, the software calculates historical Upper and Lower Control Limits (UCL: 54.01, LCL: 50.79). The visual verification indicates statistical control without Nelson rule triggers.
Software observation: Mathematical control boundaries reflect only the mathematical model of sampled subgroup data.
Operational Process Intervention
Between observation runs, maintenance teams performed tooling calibration and modified raw feedstock batch sourcing. The physical operating system underwent deliberate physical changes that mathematical models cannot independently detect.
Physical Event Log: Tooling re-centered on October 12th; batch hopper switched to Vendor B granular material.
Key insight: Physical changes happen in real machinery and workflows, not inside data files.
Subsequent Window Acquisition (Subgroups 26 to 50)
New time-ordered points are appended. If evaluated using Phase 1 limits, points 28 through 35 sit continuously above the original center line, with points 33 and 34 violating the upper 3-sigma boundary.
Diagnostic signal: The distribution has changed in level or width, signaling non-random external causes.
Pattern & Dispersion Comparative Review
Splitting the chart into two distinct phases inside Minitab reveals a true level shift. The post-change mean moved from 52.4 mm to 53.7 mm, while within-subgroup range dispersion expanded by 14 percent.
Statistical verdict: A distinct process shift is statistically confirmed, but the mechanism remains unstated.
Context Note & Directed Follow-Up
Control chart calculations confirm *that* the process shifted, but they never determine *why*. The analyst must query the logbook, calibrate machine wear, and verify material density at the station.
Actionable Verification Questions:
- Did the tooling adjustment alter machine feed alignment?
- Does Vendor B material exhibit different shrinkage coefficients?
- Was the measurement gauge recalibrated between run windows?
Summary rule: Statistical software flags signals; humans uncover cause through systemic inquiry.
Software Boundary Principle
Minitab is an established statistical engine designed to calculate limit coordinates, subgroup standard deviations, and run-rule violations with precision.
However, software algorithms possess zero ambient awareness. When a special-cause point triggers red in Minitab, the software cannot tell if a bolt loosened, an operator swapped shifts, or ambient humidity spiked.
Software Computes:
Means, standard error, control limits, run rules, and stage separations.
Field Investigation Discovers:
Operational logs, physical wear, sensor drift, and procedure handoffs.
Guide Core Curriculum
A systematic path from raw temporal data preparation to robust statistical interpretation and field investigation governance.
Time-Ordered Process Data
Reviewing sequence-dependent characteristics ensures trends and cyclical drifts are visible before random aggregated summaries mask temporal signatures.
Stable vs Unusual Variation
Distinguish routine statistical noise inherent in a baseline setup from assignable spikes requiring immediate physical troubleshooting.
Center Line & Limits
Master how 3-sigma thresholds are derived from subgroup dispersion rather than customer specification tolerances or design quotas.
Common-Cause Context
Understand why tweaking parameters in response to standard common cause variation causes unnecessary tampering and increases overall output variance.
Special-Cause Signals
Interpret Western Electric and Nelson pattern triggers in Minitab: nine consecutive points on one side, trending runs, and sudden limit violations.
Before-and-After Changes
Implement multi-stage control limits to demonstrate statistical shifts, proving whether a physical process upgrade yielded a legitimate variance reduction.
Stability Before Capability
Why capability metrics like Cpk and Ppk are mathematically invalid on unstable processes. Stability establishes predictive credibility before indices matter.
Documenting Process Context
Maintain structured event logs alongside data files so historical out-of-control occurrences link directly to real shifts, lot numbers, and repairs.
Systemic Tools Comparison
Examine what standard statistical software produces versus what VariationWindow adds: linking data signals directly to operational reasoning.
Complementary Analytical Boundary
Independent Publication Disclosure
VariationWindow Fieldbook is an independent educational publication dedicated to statistical quality engineering and operational problem diagnosis. Minitab® is a registered trademark of Minitab, LLC. This publication is neither affiliated with, sponsored by, nor endorsed by Minitab, LLC.