Treating Out-of-Control Points as Inquiries
In statistical process control, a signal represents an unambiguous mathematical statement: the variation at this point is inconsistent with common-cause background noise. What it does not say, however, is why the shift occurred or which mechanical component degraded.
Teams often leap straight from a point breaching upper control limits to an unverified technical verdict. A sudden temperature spike gets blamed on an ambient ventilation shift, or a batch viscosity drop gets attributed to vendor raw materials without physical corroboration. When operators treat a chart signal as an immediate root cause, they inevitably adjust valves, tweak setpoints, or replace tooling in haste. This reaction introduces synthetic variation, degrading process capability rather than stabilizing it.
- A signal pinpoints the exact time envelope and batch identity where special-cause variation entered the system.
- It questions the stability of operational parameters without validating any single hypothesis on its own.
- Immediate machine tweaking without physical containment frequently produces Deming funnel tampering.
Distinguishing the alert from the underlying failure mechanism requires maintaining strict baseline discipline. Until logs, tooling wear measurements, and operator shift notes verify the mechanism, the signal remains an inquiry demanding structured investigation.
“A control chart will tell you precisely when your assumptions failed; it expects you to do the investigative work to uncover why.”
Navigating Between False Attribution and Physical Facts
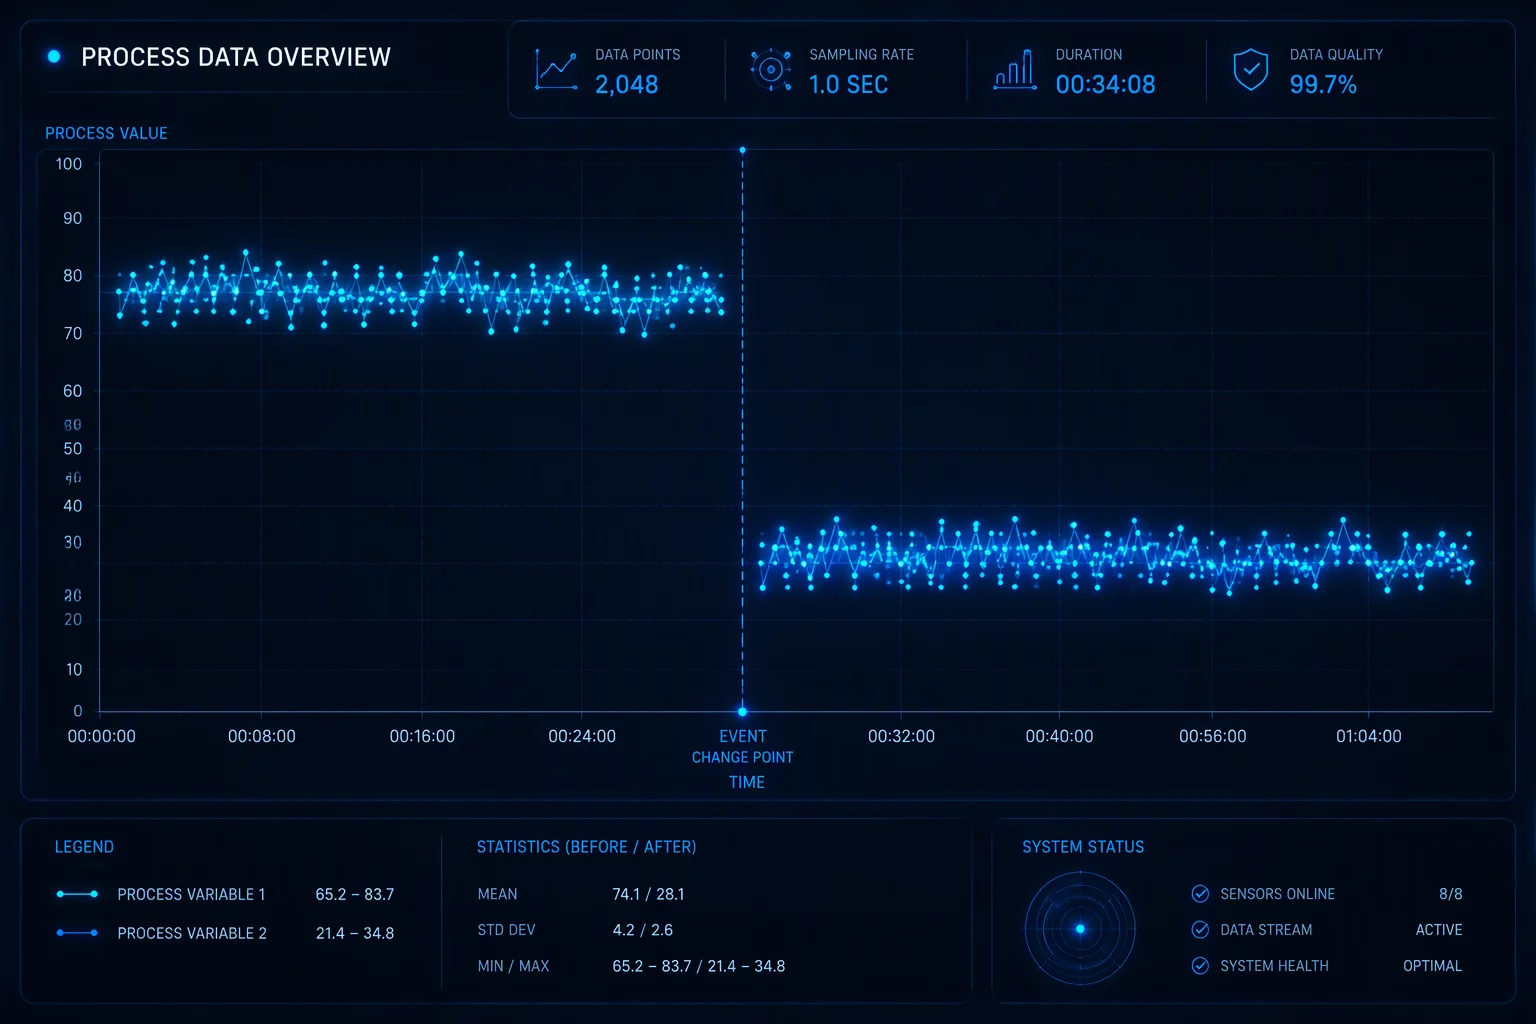
To transform an alert into an actionable finding, quality engineers must reconstruct the timeline surrounding the anomaly. In our thermal forming evaluation, a continuous temperature chart registered three consecutive points above the upper control limit during a Tuesday graveyard shift. Initial maintenance notes asserted an electrical heating coil failure, prompting a scheduled four-hour shutdown. However, subsequent thermal imaging revealed the heating coils functioned within nominal tolerances, while an unrecorded raw material pallet swap had altered cycle heat absorption.
This discrepancy underscores the hazard of conflating the indicator with the cause. The data point signaled that thermodynamic equilibrium had broken, yet the mechanical explanation required physical cross-checks across feedstocks, operator logs, and calibration timestamps. When personnel document environmental and material parameters concurrently with chart generation, investigation windows contract from days to hours, preserving baseline validity.
Building a Structured Inquiry Discipline
A mature quality engineering culture treats chart deviations as starting flags for multidisciplinary root-cause inquiries. The primary protocol begins with containment: determining whether consecutive units meet technical boundary conditions while retaining quarantine controls. The second phase audits contextual operating notes, verifying whether scheduled maintenance, tooling replacements, or environmental shifts coincided with the timestamp. Only after eliminating measurement system errors and routine operational handoffs should engineering teams proceed to mechanical adjustments.
Adopting this inquiry-first approach prevents systemic tampering and ensures that corrective actions address real special causes. Over time, recurring signals cease to be sources of operational panic and become clear signposts directing engineering effort toward robust equipment reliability and repeatable yield.
Related Articles
Frequently Asked Questions
Adjusting equipment immediately upon an out-of-control signal without physical diagnosis often introduces artificial variation, a mistake known as tampering. The signal confirms that a special cause is present, but adjusting arbitrary settings before identifying the exact mechanical or material source almost always widens overall process variation.
The immediate priority is containment and context capture. Verify whether current output meets specifications, isolate the affected batch window if necessary, and document all active operating conditions including raw material lots, ambient conditions, and operator shift changes before any machine settings are altered.
A signal indicates that the process is behaving inconsistently with its historical statistical distribution, even if the measured parts still fall within engineering tolerance limits. Conversely, a defect is a failure to meet customer specifications. A stable process can produce defects, and an out-of-control process may produce parts within specification during an alarm.
Key Analytical Takeaways
A control chart breach marks the presence and timestamp of non-random variation, acting as an alert rather than an explanation of physical cause.
Reactive adjustments made without verified root causes inject synthetic disturbances and systematically degrade long-term process capability.
Rigorous shift logs, material change records, and calibration data provide the necessary physical context to isolate real failure mechanisms.
Request Analytical Consultation
Inquire directly on statistical baseline validation and review specific parameters of this case.