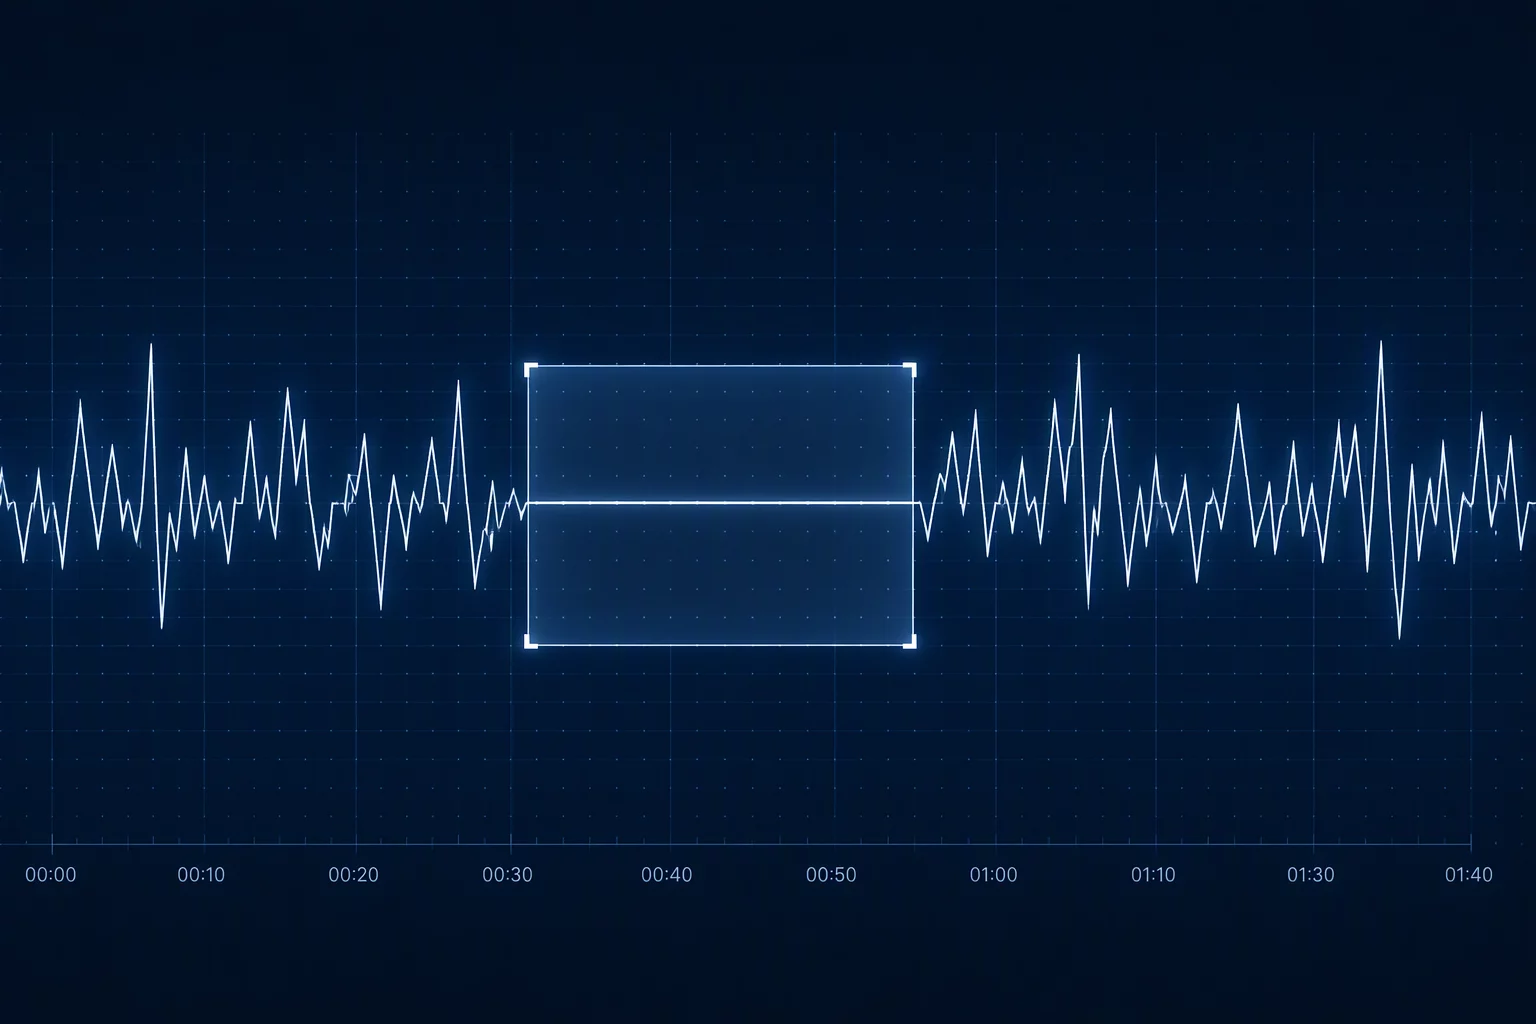
Separating Authentic Baseline Periods from Transient Calm
Every production line exhibits continuous variability, yet setting reliable statistical control limits requires identifying an operating period where only common causes act upon the output.
Engineering teams frequently fall into the trap of selecting a convenient sequence of consecutive parts during a smooth run. This brief interval often looks peaceful on statistical summaries, but it merely mirrors momentary luck rather than true process stability. A valid baseline window must reflect the full spectrum of predictable operational cycles, including standard raw material batch turnovers, scheduled shift changes, and natural ambient thermal fluctuations. If limits are calculated from an overly sanitized sample, normal daily variation will trigger frequent false alarms.
- Material lot changes must span at least two verified shipments to encompass standard vendor tolerances.
- Routine operator transitions and shift turnovers must be integrated rather than excluded as rogue anomalies.
- Measurement system variation should be pre-assessed via gauge repeatability tests to avoid mistaking gauge noise for process drift.
Process stability cannot be proven by the mere absence of alarms when the sampling interval is too wide. Sparse testing schedules often allow entire cyclical swings to slip undetected between consecutive subgroup checks. Conversely, over-clustering data samples inside a single hour exaggerates within-subgroup consistency, manufacturing artificial out-of-control signals during standard day-to-day transitions. Finding the true window balances observation depth against operational breadth.
“An authentic baseline window is never a curated highlight reel of your cleanest shift; it is an honest record of common-cause variation under standard discipline.”
Essential Tests for Baseline Window Validation
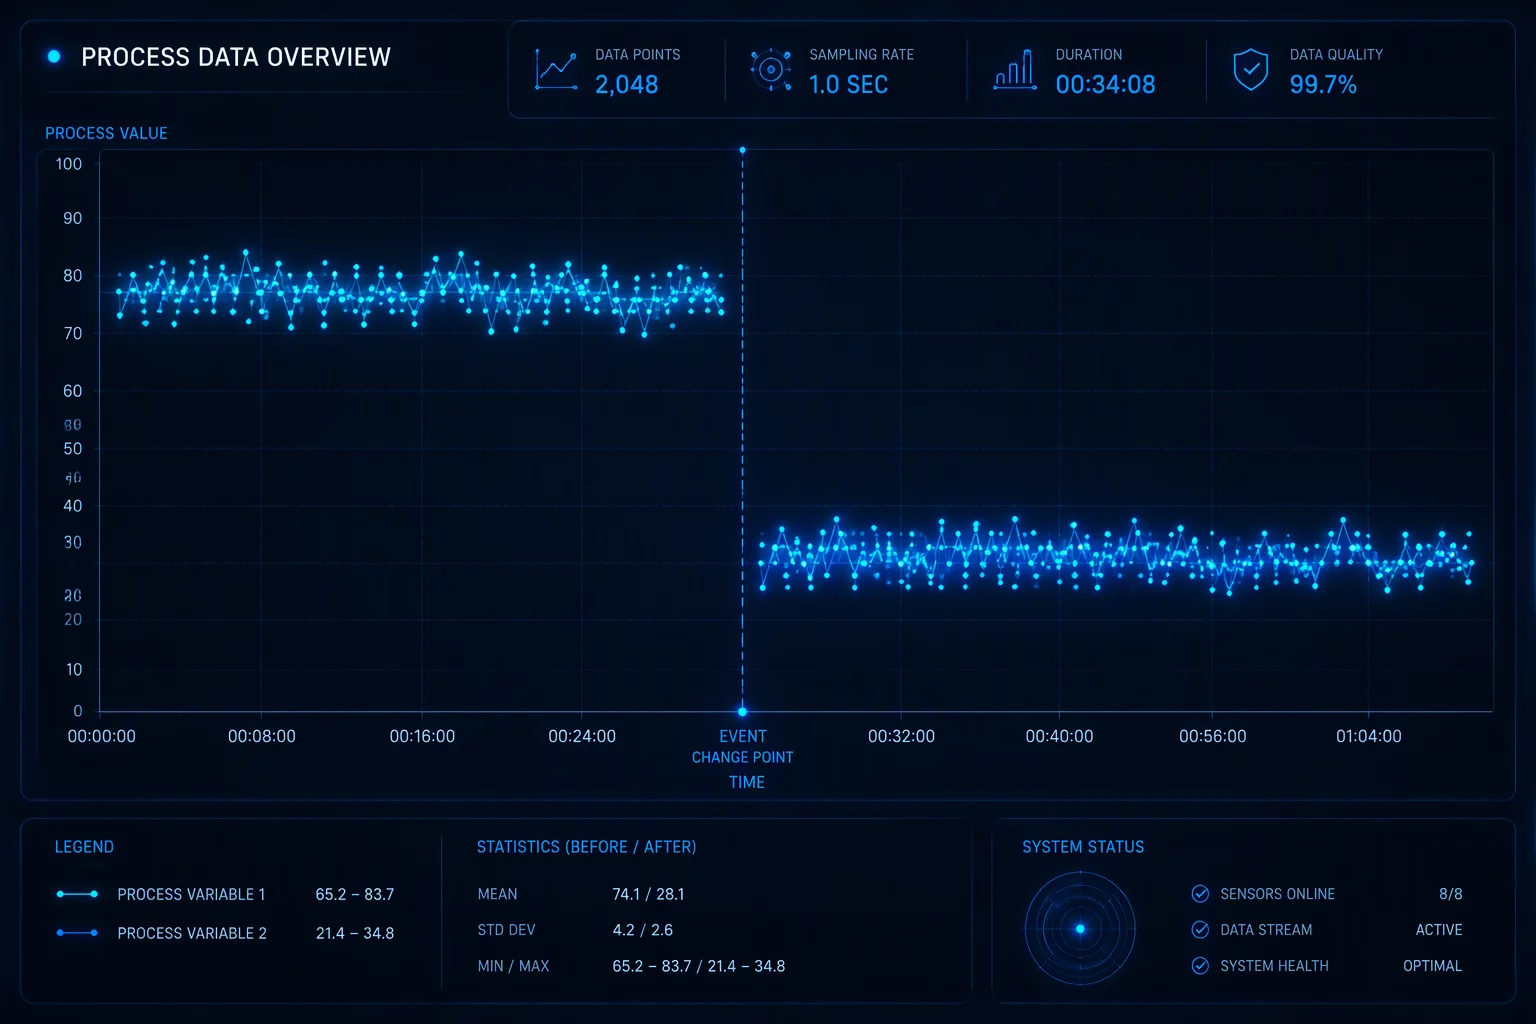
Validating a baseline period requires rigorous graphical and mathematical inspection across at least twenty-five distinct subgroups. The data sequence must be checked against non-random rules: nine consecutive points on one side of the centerline or six continuously trending values indicate an unrecognized process shift. When these patterns appear, the candidate period cannot be frozen into reference limits because the process was actively migrating between different states.
Alongside run-order tests, historical context logs play a decisive role. Quality engineers cross-check production telemetry against maintenance logs, raw material lot numbers, and machine speed records. If a calm window coincided with deliberate line slowdowns or temporary 100% sorting gates, the resulting numbers do not represent the baseline of standard high-volume manufacturing.
Maintaining Limit Relevance and Preventing Drift
Once an authentic baseline window passes both randomness tests and operational verification, the resulting statistical limits can monitor routine production. However, engineering teams must not treat these parameters as static monuments. Gradual machine wear, ambient seasonal transitions, and minor component revisions will subtly shift background variation over months of continuous operation.
Regular window audits maintain long-term confidence. Whenever an intentional process enhancement, tooling rebuild, or formulation update takes place, engineers archive the previous baseline and initiate a structured re-baselining campaign. This disciplined approach prevents obsolete limits from producing false alarms or masking genuine special causes.
Related Articles

Frequently Asked Questions
Standard statistical methodology requires between twenty and thirty rational subgroups of four or five consecutive parts each, yielding at least one hundred total observations. This sample size provides the statistical sensitivity needed to establish reliable center lines and control limits without excessive estimation error.
The point must be investigated immediately for an assignable special cause. If a documented reason is confirmed and the cause eliminated, the subgroup can be excluded from the baseline calculations. If no assignable cause is identified, the process is not yet stable, and the window must be extended.
Baselines require re-evaluation whenever deliberate modifications occur, such as equipment overhauls, tooling changes, or material recipe alterations. In stable operations, teams conduct quarterly limit audits to ensure baseline boundaries match current common-cause performance.
Key Analytical Takeaways
A dependable baseline must encompass standard shift changes, operator handoffs, and regular material lot deliveries rather than a single ideal run.
Never calculate limits from raw numbers alone; cross-reference candidate timestamps with maintenance logs and speed settings to ensure standard conditions.
Archive historical baselines and calculate new control boundaries whenever documented engineering improvements or physical modifications take place.
Request Analytical Consultation
Inquire directly on statistical baseline validation and review specific parameters of this case.