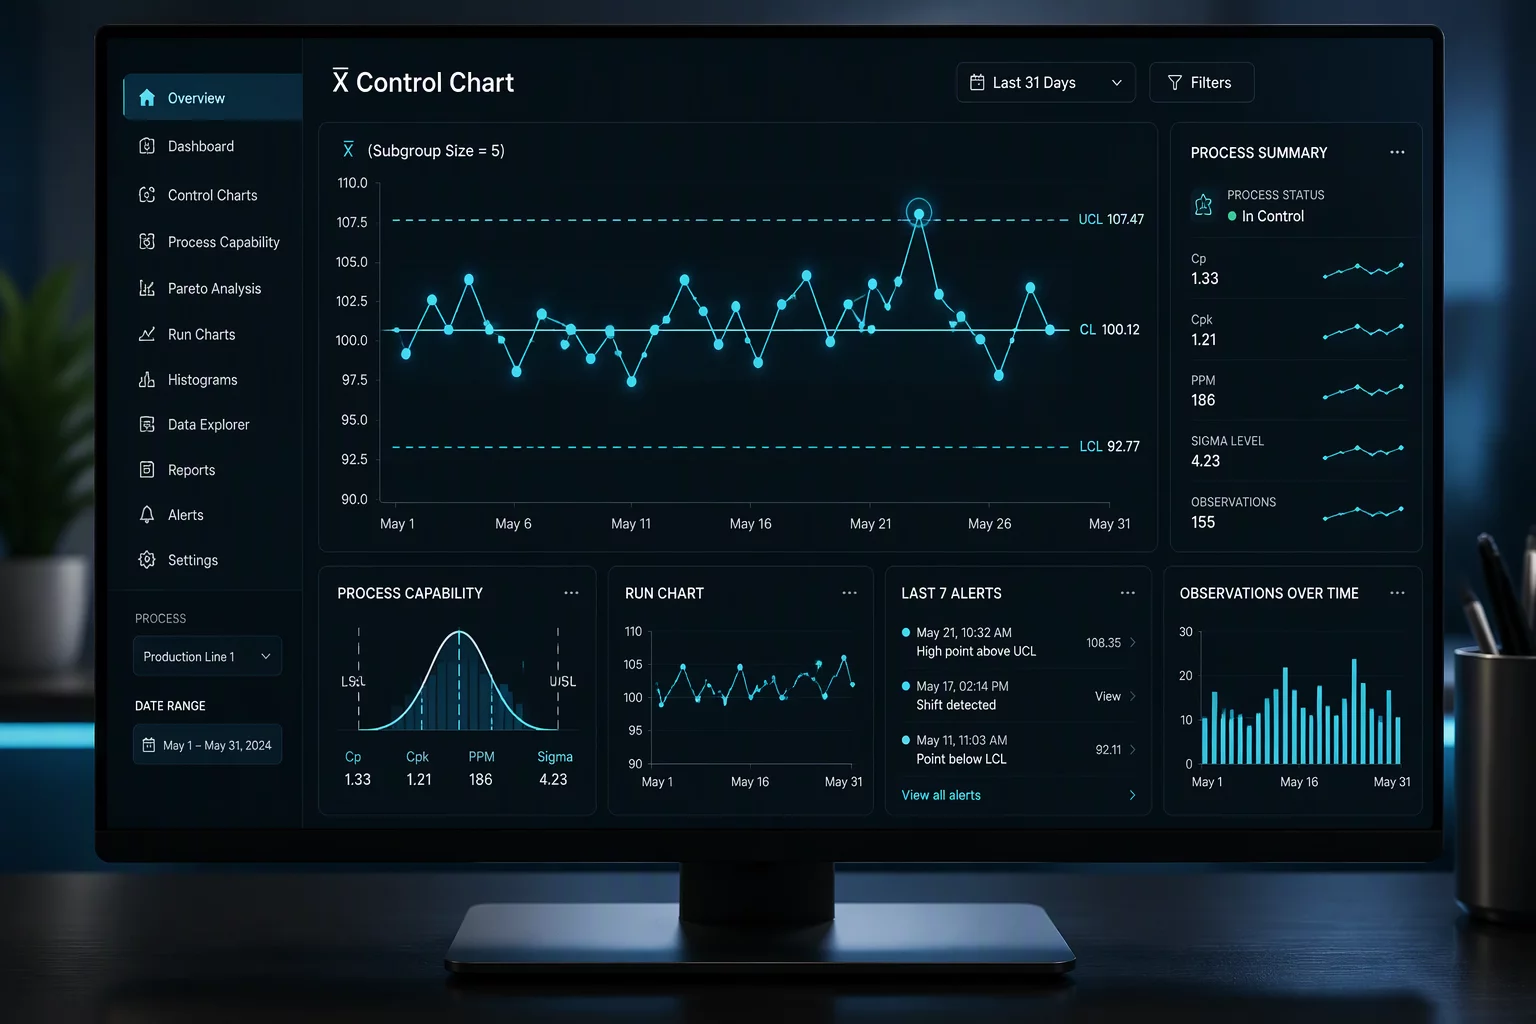
Rethinking Static Tolerances with Adaptive Process Boundaries
Manufacturing lines have historically relied on rigid upper and lower specification limits calculated from isolated, single-variable data distributions. When environmental humidity shifts, tool wear accumulates, or material viscosity changes slightly, individual parameters often remain technically within their separate green zones while their joint interaction triggers unpredicted defects. AI driven analytics resolves this limitation by mapping multidimensional operating spaces where boundary lines adapt to shifting baseline conditions rather than staying fixed to historic calendar averages.
By training high-dimensional algorithms on verified runs of stable variation, the system constructs a dynamic boundary envelope. It assesses temperature, pressure, feed rate, and chemical concentrations simultaneously, continuously evaluating whether the current production batch resides comfortably inside the safe centroid or approaches an instability perimeter. This proactive detection exposes micro-correlations long before traditional control charts flag an out-of-control run rule.
Consultation Protocol
Request an Analytical Process Review
Connect with our quality engineering team to evaluate multivariable variation patterns and implement adaptive boundary models across your production streams.
Core Summary
Critical Engineering Insights for Boundary Design
Univariate tolerances regularly fail to detect multi-parameter interaction anomalies that cause output failures.
Boundary recalculation must be governed by statistical drift thresholds rather than arbitrary daily recalibration loops.
Production contextual tags, such as raw batch vendor and ambient temperature, are necessary to prevent false anomaly triggers.
A dependable process window is not a static perimeter drawn once on a printout, but a responsive mathematical space that accounts for continuous physical interdependencies.
Variation Analysis Research Group, Fieldbook Quality Division
System Execution
Configuring and Executing the Adaptive Boundary Engine
Deploying machine learning models for process window identification begins with time-series feature normalization. Sensor streams must be aligned to discrete manufacturing cycles, removing sensor warmup artifacts and non-operational downtime intervals. The system standardizes variance across dissimilar physical dimensions, converting raw pressures, velocities, and thermal readings into unified Euclidean distance metrics.
Once normalized, the algorithm maps high-density clusters corresponding to historically verified product stability. When incoming operational points migrate toward peripheral regions of the cluster, automated diagnostic flags trigger targeted adjustments. Operators observe the exact contributing variables driving the drift rather than spending critical response time diagnosing vague system-wide alarms.
Four-Stage Implementation Protocol
Baseline Partitioning: Isolate homogeneous production periods devoid of maintenance interruptions or raw batch substitutions.
Hyper-Dimensional Envelope Fitting: Construct multivariate convex hulls or kernel boundaries that enclose 99.73 percent of steady-state operational vectors.
Real-Time Vector Scoring: Calculate real-time Mahalanobis distances for every successive telemetry burst against the active window centroid.
Recalibration Governance: Validate deliberate engineering modifications before incorporating updated operational vectors into the baseline window.
Analytical Evaluation
Analytical Validation & Boundary Verification
Rigorous verification requires evaluating algorithmic models against physical verification coupons and final part inspection registries. An over-sensitive model produces frequent false positives that disrupt production schedules, whereas an excessively permissive model fails to prevent non-conforming lots. Balance is established by tuning anomaly rejection filters using historical challenge data where subtle out-of-tolerance events previously escaped conventional SPC detection.
Quality teams must maintain oversight through periodic residual audits. Comparing predictive envelope trajectories with post-process metrology confirms that the analytical window remains locked to genuine product stability, delivering dependable operational confidence across varying ambient conditions and extended fabrication cycles.
Related Material
Complementary Technical Field Guides
Simulation
Process Simulation Analysis Fundamentals
Explore foundational methods for virtualizing production cycles and testing parameter resilience prior to factory floor execution.