Real Time SPC Updates and Multilingual Interface Guide
Practical protocols for synchronizing live streaming metrology data, maintaining control limit stability, and deploying localized user interfaces across distributed manufacturing plants.
Date: August 15, 2026•Author: Quality Team•Read Time: 7 min read
Specification Summary
Architecture & Operational Specs
Data Stream Latency
Sub-second ingestion (< 350 ms cycle)
Localization Scope
14 language dictionaries with locale-specific formatting
Limit Update Protocol
Baseline-locked calculation with automated drift flags
Standard Compliance
Aligned with ISO 22514-2 and AIAG SPC Reference Manual
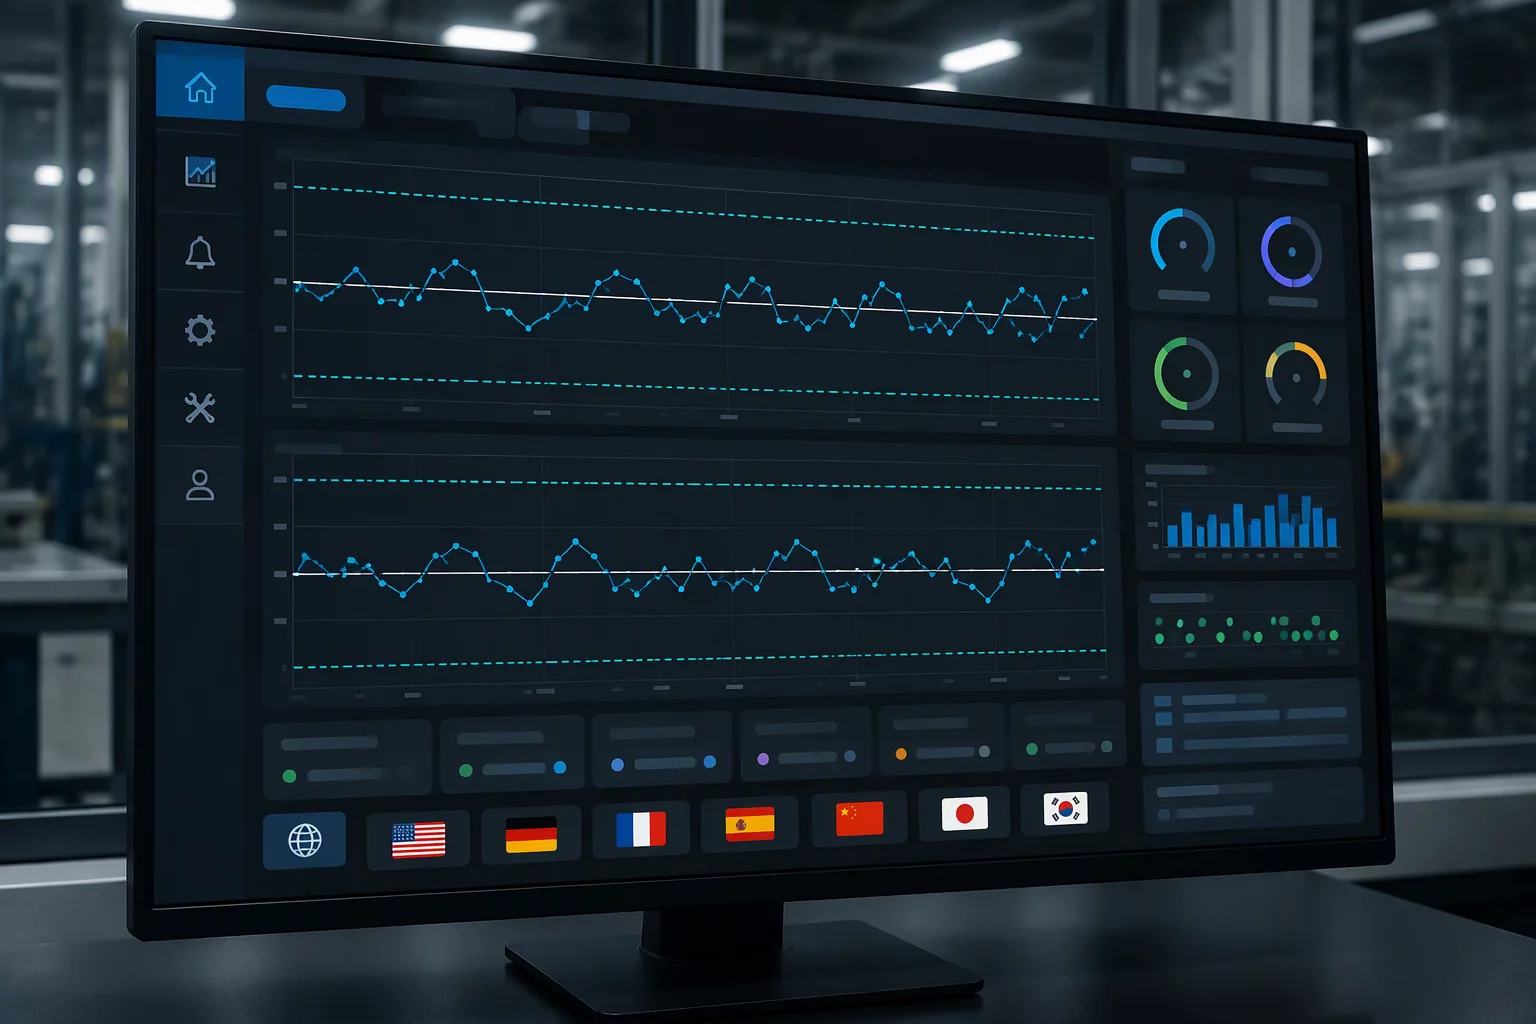
High-throughput manufacturing environments continuously stream dimensional measurements, thermal profiles, and pressure readings directly from production machinery. Plotting these data points onto statistical process control charts in real time enables operators to identify emerging shifts long before products exceed engineering specification limits. However, establishing live updates requires strict mathematical discipline: incoming points must populate against a verified baseline rather than triggering recalculations with every single arrival.
Coordinating quality standards across global manufacturing sites introduces further interface complexities. Plant engineers in different countries must view identical statistical signals, yet operators require localized field designations, decimal delimiters, and alarm descriptions. Designing a decoupled architecture ensures that numerical calculations remain invariant while the visual presentation adapts seamlessly to the operator's native language and local numeric conventions.
Consultation Protocol
Request an In-Depth Architecture Consultation
Connect with our engineering specialists to evaluate your streaming telemetry architecture, control chart baseline protocols, and global dashboard localization.
Core Summary
Key Implementation Principles
Lock control limits to an established 25-to-30 subgroup baseline rather than calculating moving limits continuously during live runs.
Process all statistical telemetry in standardized floating-point units before rendering client-side localized text strings.
Implement FIFO queue buffers to manage micro-bursts of high-frequency sensor readings without losing chronological sequence.
Maintain consistent alarm color coding and rule numbering worldwide to ensure unambiguous cross-facility root cause reviews.
A real-time control chart is an operational diagnostic tool; recalculating control limits on the fly degrades it into an uncalibrated noise monitor.
Manufacturing Quality Engineering Handbook
System Execution
Designing Limit Recalculation Safeguards and UI Localization
When streaming telemetry feeds directly into an SPC engine, the greatest risk is algorithmic oversensitivity. Recalculating upper and lower control limits with every newly arrived subgroup causes limits to expand during high-variation batches, masking out-of-control conditions, or contract during steady periods, producing false alarms. Production platforms must enforce a formal baseline lock mechanism where limits remain static until an intentional, documented process intervention triggers a controlled baseline reassessment.
Localization in an engineering interface requires more than translating button text. Number formatting conventions differ widely: European facilities often rely on commas as decimal separators where North American lines expect points. Date and timestamp formatting must conform to ISO 8601 to eliminate shift ambiguity. The presentation layer handles all localization via lightweight dictionary files keyed to locale codes, while the underlying analytical engine computes raw floating-point calculations with uncompromised precision.
Recommended Implementation Steps
Ingestion Pipeline Setup: Configure MQTT or WebSocket streaming connections with local buffer caching to tolerate brief network disconnects without data loss.
Baseline Window Verification: Gather and validate 25 to 30 consecutive in-control subgroups to fix the center line, upper control limit, and lower control limit.
Dictionary Layer Integration: Implement JSON translation tables for all chart labels, Nelson rules, and error states, ensuring precise engineering terminology.
Real-Time Signal Validation: Run synthetic test data streams containing known process shifts to confirm that run-rule alarms trigger reliably across all interface languages.
Analytical Evaluation
Maintaining Statistical Validity on the Factory Floor
The primary goal of real-time SPC is prompt corrective action when special causes arise, paired with deliberate non-interference when variation remains purely common cause. When an operator spots a run of seven consecutive points on one side of the center line, the system must clearly signal a process shift rather than an isolated outlier. Visual clarity and instant comprehension across all shifts and linguistic backgrounds prevent uncoordinated machine tampering.
Regular audit protocols ensure ongoing stability. By logging raw time-series data separately from rendered chart states, engineering teams can replay historical production runs under alternate rule thresholds to fine-tune sensitivity. This separation of concerns guarantees complete auditability, supports regulatory compliance, and fosters consistent operational confidence across all international production sites.
Related Material
Related Technical Guides
Simulation
Process Simulation Analysis Fundamentals
Learn computational simulation methods for forecasting variation and validating process windows prior to physical production.