Interpreting Dense Scatter Matrices Through Automated Natural Language
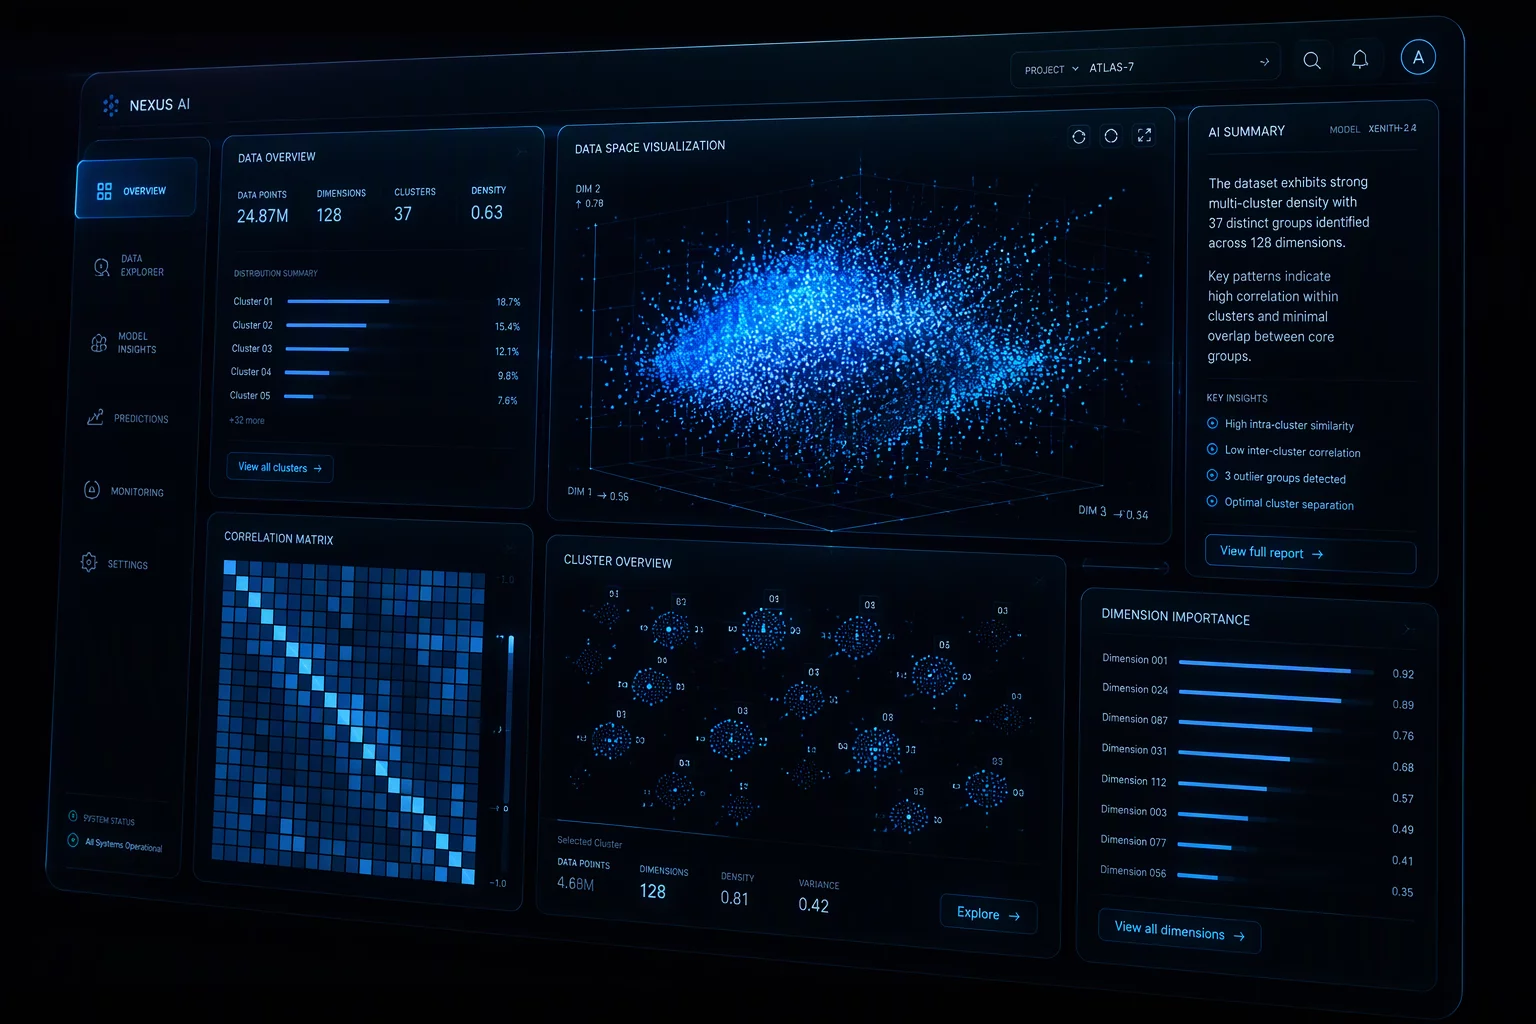
High-speed manufacturing generates dozens of continuous process streams simultaneously, ranging from thermal zones and feed rates to cavity pressures and chemical concentrations. When quality engineers inspect twenty or thirty interacting variables, traditional pairwise scatter plots expand into cumbersome matrices that overwhelm visual review. An automated AI plot summary evaluates each cell within the scatter matrix, detecting linear drift, curvilinear dependencies, and clustering tendencies without requiring manual inspection of dozens of individual graphs.
Instead of forcing engineers to scan through hundreds of miniature Cartesian coordinates, the system converts bivariate relationships into prioritized text explanations. It highlights non-linear curvature, flags bivariate outliers that slip past standard univariate range checks, and isolates clusters corresponding to specific production shifts or raw material batches. By linking numerical correlation metrics directly to narrative observations, engineering teams isolate cross-parameter dependencies rapidly during root cause investigations.
Consultation Protocol
Request an Engineering Diagnostic Consultation
Submit your operational parameters to discuss high-dimensional scatter matrix evaluations and custom statistical interpretation routines with our technical team.
Core Summary
Key Analytical Findings in Matrix Plot Summarization
Univariate control charts frequently miss joint bivariate drift that scatter matrices expose immediately.
Automated summaries calculate both Pearson linear r and Spearman monotonic rank orders to flag non-linear arcs.
Outlier isolation uses Mahalanobis distance thresholds to prevent high-leverage points from distorting automated text narratives.
Cluster detection algorithms automatically annotate distinct operating islands caused by differing machine tool fixtures or recipe steps.
Automated narrative summaries do not replace raw scatter data; they serve as a dynamic filter that directs engineering attention straight to non-random covariance patterns.
Quality Engineering Fieldbook, Analytical Visualizations Series
System Execution
System Execution: Transforming Scatter Matrices into Structured Summaries
The evaluation engine begins by constructing an n-by-n correlation grid where every continuous factor is paired against every other factor. For each pairwise intersection, the module computes parametric correlation coefficients, residual normality tests, and Cook’s distance metrics for influential points. When non-random associations or high dispersion are found, the language generation layer translates these mathematical signals into concise engineering statements.
Deploying this automated summarization in production environments standardizes how shift handovers and technical audits assess multi-factor variation. Below is the operational sequence followed by the diagnostic routine when ingesting multi-stream telemetry.
Four-Stage Matrix Decomposition and Narrative Synthesis
Bivariate Grid Construction: Filter raw sensor registers, apply baseline window alignments, and assemble the pairwise coordinate matrix across all selected parameters.
Coefficient and Curvature Testing: Execute simultaneous linear regression and polynomial fits to detect U-shaped or asymptotic responses that linear r values obscure.
High-Leverage Outlier Filtering: Calculate studentized residuals and leverage statistics to separate single-point instrumentation spikes from genuine multi-point process shifts.
Narrative Summary Compilation: Synthesize prioritized natural language bullets grouping variables by strong correlation, moderate interaction, or distinct multi-modal clustering.
Analytical Evaluation
Ensuring Analytical Validity and Guarding Against False Correlations
Automated narrative tools must never be treated as definitive causal proof. In dense matrices containing twenty or more variables, spurious statistical correlations can arise purely by random chance or through shared temporal trends. The fieldbook methodology mandates cross-referencing AI summaries with physical process knowledge, confirming whether an identified relationship reflects thermodynamic, mechanical, or chemical realities.
Furthermore, the AI summary engine verifies stability baselines prior to generating correlation statements. If an upstream variable is undergoing severe out-of-control oscillations, downstream scatter plots will display artificial elongation that misrepresents normal operational dynamics. Maintaining strict baseline stability checks ensures that plot summaries reflect true steady-state covariance rather than transient process upsets.
Related Material
Related Analytical Guides & Toolkits
Analytics
AI Driven Analytics for Process Windows
Learn how machine learning models detect multivariate drift and establish dynamic operating windows in production streams.