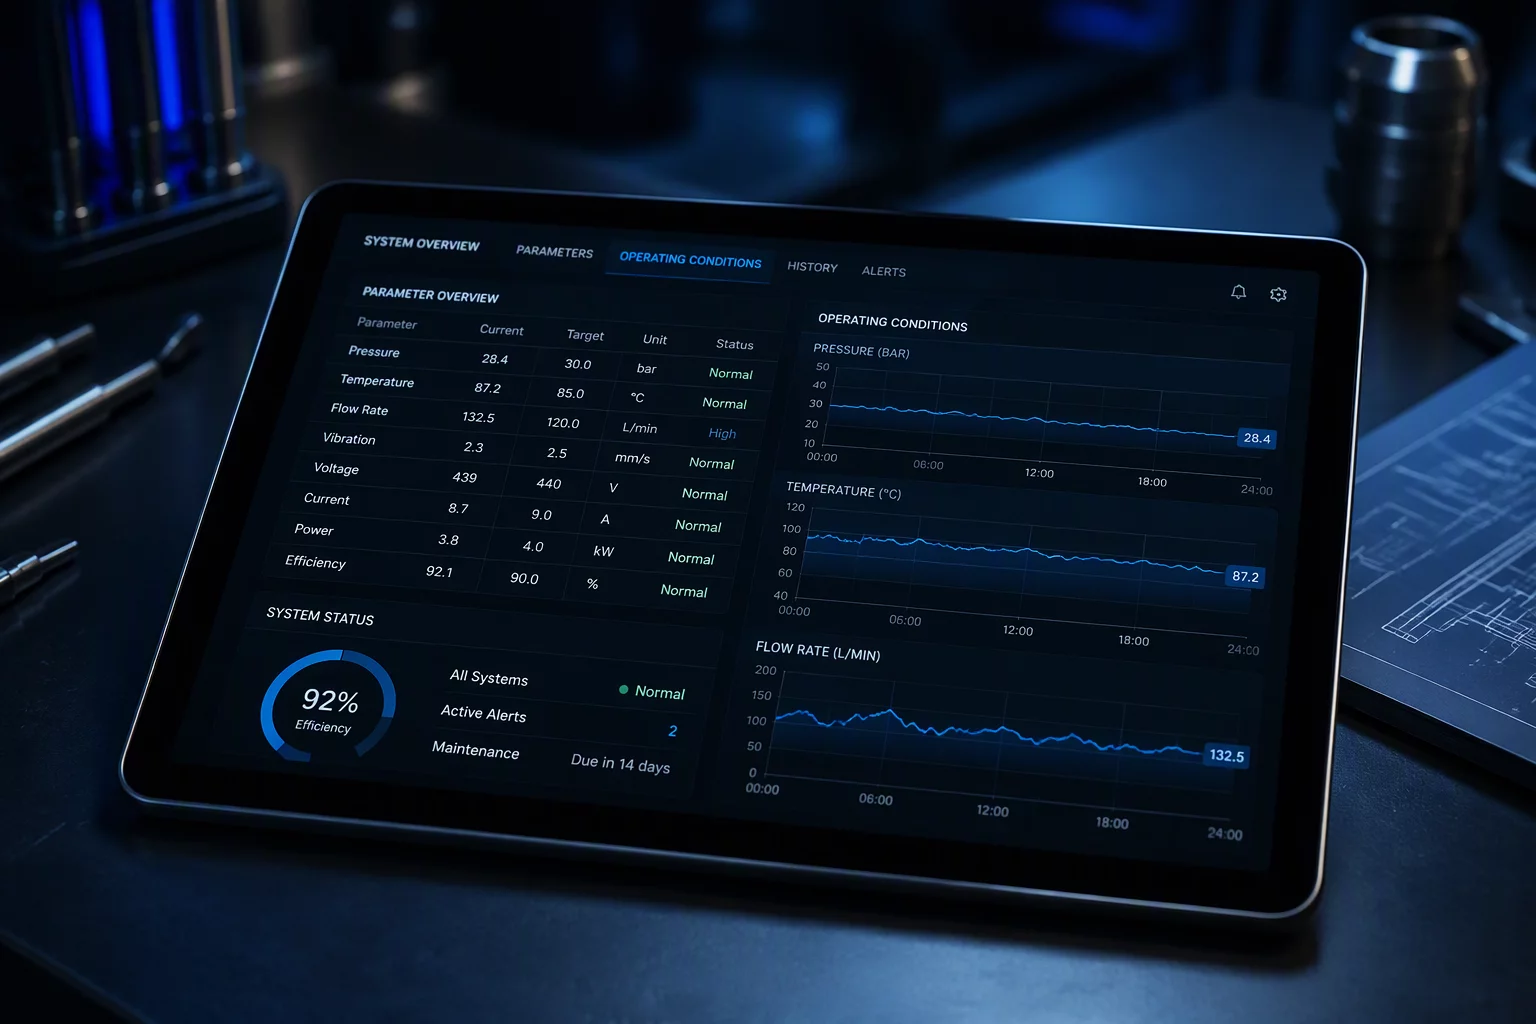
Why Numerical Data Fails Without Recorded Operating States
Data points on a control chart reflect what occurred during a cycle, but they cannot explain the physical causes without documented operating states.
In industrial environments, operators frequently record metric outputs while omitting the specific state under which machines ran. A thickness or pressure reading means very little when tooling wear, motor feed rate, ambient room humidity, and raw material batch codes remain unrecorded. When an engineer pulls the data six weeks later, unnoted changes look like spontaneous process shifts, leading teams to chase phantom variations.
- Capture feed rates, line speeds, and temperature setpoints alongside every timestamped measurement.
- Record raw material batch changes and supplier lot identifiers during scheduled product runs.
- Log shift handovers, operator rotations, and routine maintenance interventions in real time.
Engineers who treat baseline construction as a purely mathematical exercise often group completely distinct operating conditions into a single control limit calculation. The result is an artificially widened standard deviation that disguises genuine out-of-control signals and compromises subsequent capability assessments.
“A control chart without operational context shows the noise of the process, but tells you nothing about the mechanism that created it.”
Structuring Standardized Condition Logs Across Production Cycles
Building a resilient documentation procedure requires isolating static parameters from dynamic variables. Static parameters include physical line geometry, standardized tooling dies, and baseline hydraulic pressures that remain constant across standard operational recipes. Dynamic variables include batch viscosity, thermal build-up across continuous shifts, ambient moisture changes, and momentary feed pauses. Standard logs must present these factors as categorical tags connected directly to data timestamps.
Technicians should utilize structured logging fields rather than open-ended remarks. Unstructured notes like "adjusted sensor" provide almost zero diagnostic value during retrospective ANOVA or Shewhart chart reviews. Instead, recording "adjusted optical sensor gain from 3.2 to 4.1 due to surface glare" allows analysts to separate sensor intervention from true physical process movement.
Synthesizing Condition Logs for Root Cause and Baseline Partitioning
When evaluating historical trend data, documented condition changes serve as the boundary lines for partitioning baselines. Rather than forcing one set of grand averages across three distinct shifts using different material grades, analysts can calculate subgroup limits for each discrete recipe state. This reveals whether high variation stems from internal process entropy or deliberate operational adjustments.
Engineering teams that master this practice eliminate false alarms and avoid counterproductive recalibrations. Documenting conditions creates a transparent bridge between the factory floor and statistical software, guaranteeing that process modifications rest on empirical clarity rather than guesswork.
Related Articles

Frequently Asked Questions
Essential parameters include machine cycle speed, temperature profiles, tooling identifiers, raw material lot codes, operator shift changes, and maintenance adjustments. Capturing both planned recipe settings and observed ambient fluctuations ensures analytical integrity.
Notes must carry matching timestamps or direct sample batch identifiers. Entering parameters as categorical columns alongside measurement values in your data table allows automated stratification during statistical analysis.
Standardized checklists, dropdown selections on digital terminals, and automated barcode scanning for material batches minimize manual entry time to seconds while preventing transcription errors.
Key Analytical Takeaways
Unrecorded machine shifts create artificial variation spikes that distort control chart calculation limits.
Use defined parameter codes and values rather than generic descriptive remarks to enable clean stratification.
Calculate separate baseline windows whenever significant raw material or operational states shift permanently.
Request Analytical Consultation
Inquire directly on statistical baseline validation and review specific parameters of this case.