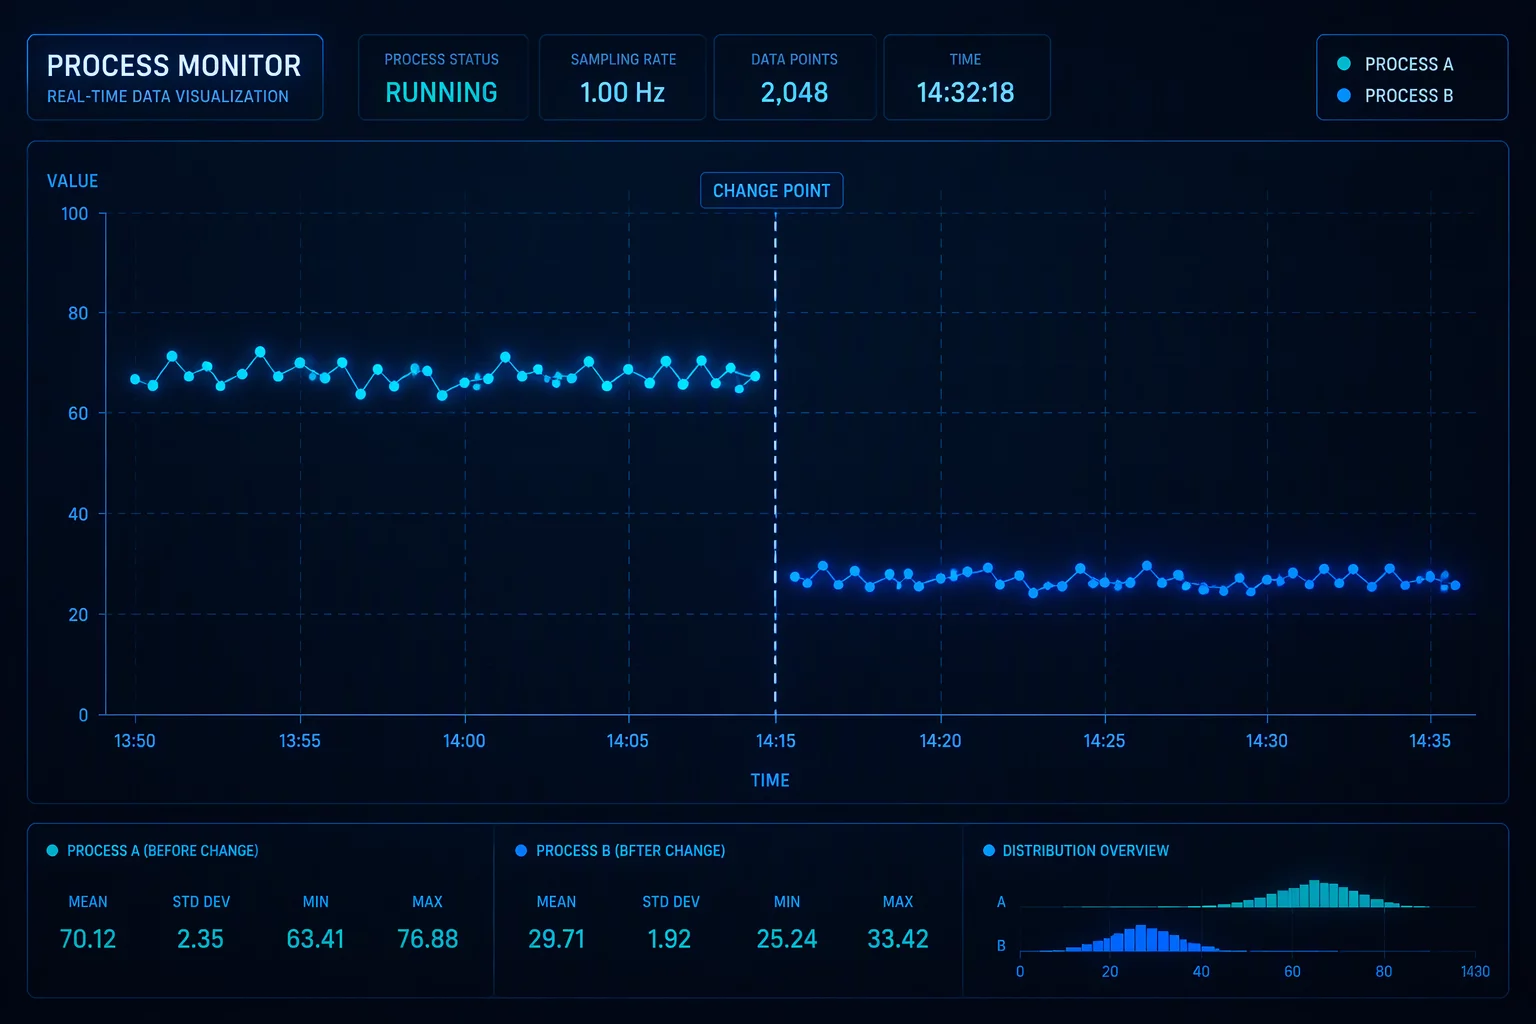
Detecting Real Shifts Across Production Centre Lines
When engineers make deliberate adjustments to machinery, equipment settings, or raw material inputs, an immediate movement in the central output often appears. The central challenge lies in proving whether this migration reflects a permanent structural enhancement or an unstable transient pattern.
Process data recorded during an industrial thermal stabilization line revealed an apparent upward displacement of 2.4 standard deviations immediately following nozzle recalibration. Production teams routinely celebrate such movements as improvements without verifying whether the new stage satisfies fundamental statistical stability requirements. True operational control demands evaluating both the new location parameter and the underlying variation spread.
- Tracking successive subgroups against original control limits to verify non-random run patterns.
- Evaluating short-term subgroup dispersion against the previous historical standard deviation.
- Documenting exact intervention timestamps to correlate physical changes with sequence numbers.
Without formal baseline separation, teams risk combining two distinct statistical distributions into a single pooled control chart. That erroneous calculation inflates sigma boundaries, obscures subsequent special cause variations, and blinds floor personnel to genuine out-of-control conditions.
“Calculating a single centerline across deliberate operational modifications destroys the diagnostic fidelity of any control chart.”
Separating Stage Statistics from Transitory Adjustments
An intentional process change must demonstrate predictable performance over an extended window before analysts establish new mathematical boundaries. In this specific case study, thirty-five sequential production lots were recorded following nozzle overhaul before fixing new baseline parameters. Initial subgroups clustered near the upper historical boundary, initially triggering false alarm alarms under old limits.
When isolating the secondary phase, the internal range showed remarkable consistency. The individual values fluctuated symmetrically around the elevated center line without drift or cyclic trends. This confirmed that the physical alteration produced a stable mean displacement rather than an unstable dispersion expansion, validating the split-phase charting approach.
Protocol for Recalculating Staged Control Boundaries
Formal statistical methodology requires establishing staged limits when intentional changes alter process averages. Rather than overwriting past history, analysts maintain historical control charts alongside the newly established phase. This dual-phase layout documents baseline migration while preserving previous operational memory.
Engineers must collect a minimum of 25 to 30 rational subgroups within the new operating state before freezing recalculations. If special causes appear during this trial timeframe, teams must eliminate root causes prior to standardizing revised upper and lower control limits.
Related Articles


Frequently Asked Questions
Standard statistical quality control practices recommend collecting at least 20 to 30 consecutive rational subgroups under identical operational conditions before locking new control limits.
Pooling datasets across a confirmed process shift creates an artificial standard deviation that obscures real operational variation. Phased control charts should always maintain separate calculations.
If dispersion expands simultaneously, the process has become less consistent regardless of centerline movement. Engineering must stabilize the dispersion chart before accepting the new central position.
Key Analytical Takeaways
Always split historical and active calculation phases to prevent pooled variance from inflating limit distances.
Evaluate the range or standard deviation chart to ensure variation remained in control throughout the mean displacement.
Correlate specific mechanical adjustments, raw material changes, and operator inputs directly to subgroup indices.
Request Analytical Consultation
Inquire directly on statistical baseline validation and review specific parameters of this case.