
Distinguishing Random Noise from Systematic Process Signals
Visualizing non random patterns in quality data serves as the earliest diagnostic barrier against silent equipment drift, tool degradation, and undetected mechanical wear.
Standard statistical process control assumes that points scatter around the center line purely under common-cause variation. When systematic forces begin acting on a manufacturing line, the data distribution ceases to behave like independent random draws from a normal population. Instead, the sequence displays telltale signatures: runs above or below the mean, unnatural hugs around the center line, or recurring sinusoidal curves tied to ambient thermal cycles. Detecting these visual cues allows process owners to intervene hours before parts breach formal upper or lower specification limits.
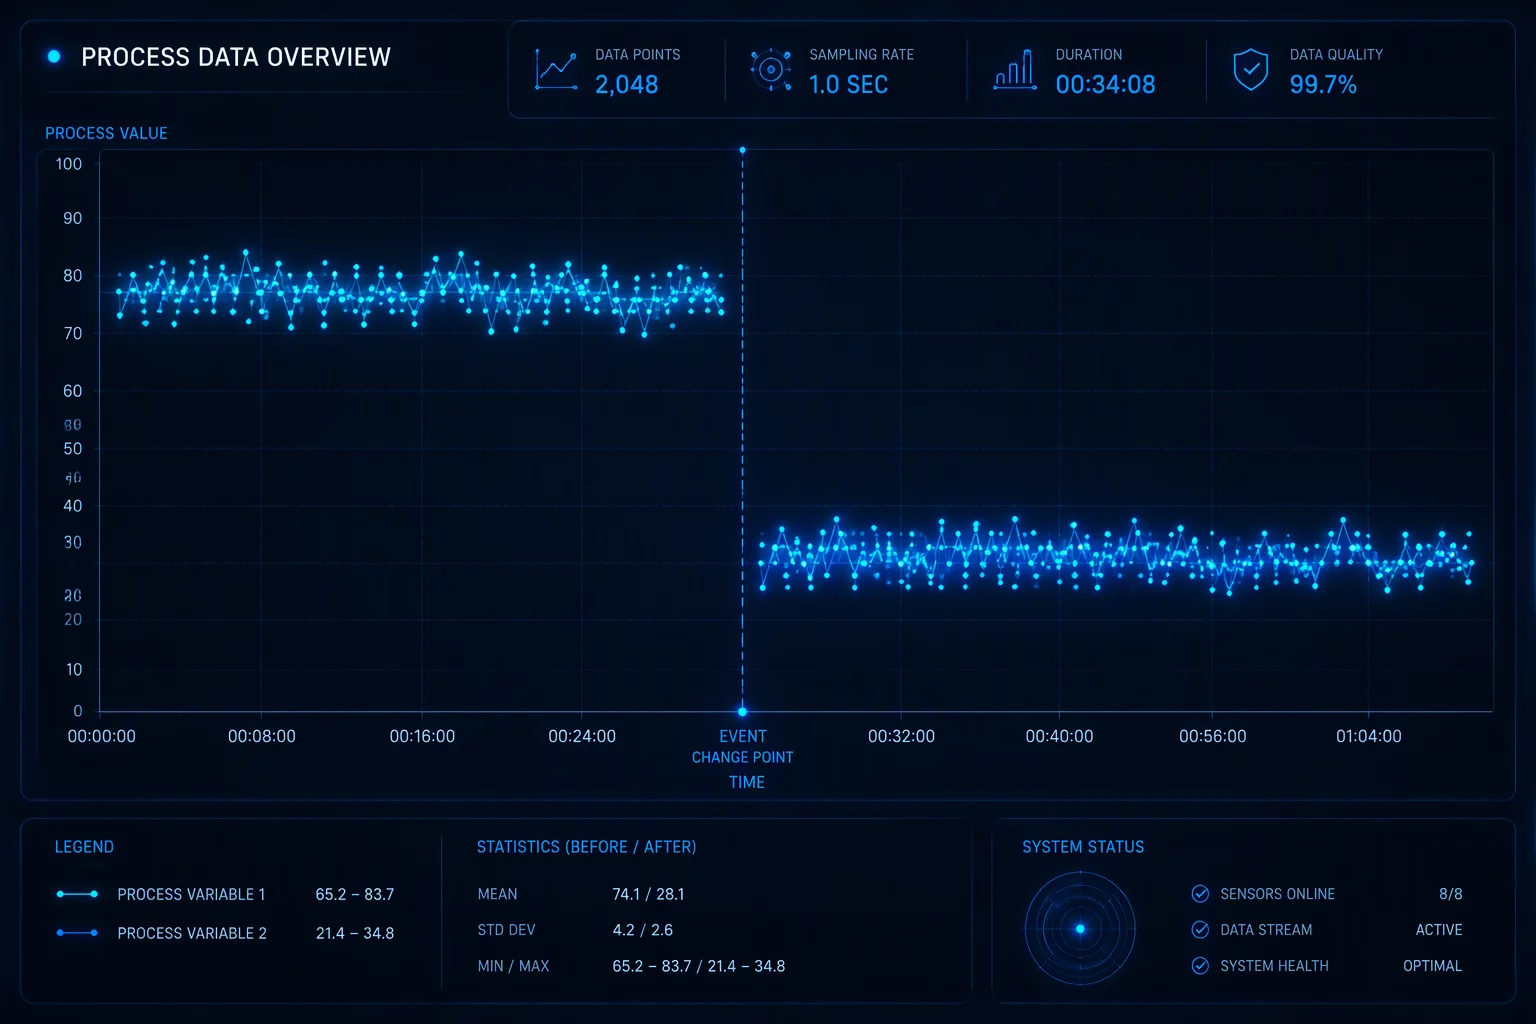
- Sustained runs of eight or more consecutive readings on one side of the mean line, signaling a true baseline shift rather than random fluctuation.
- Six consecutive ascending or descending points across consecutive sub-lots, capturing progressive tool wear, bath chemical depletion, or spindle thermal growth.
- Stratification phenomena where fifteen consecutive observations sit tightly within Zone C (within ±1 sigma), masking hidden mixture of distinct streams or sampling bias.
Operating personnel often dismiss these early visual clusters because no individual point violates the 3-sigma control boundaries. Treating within-limit clustering as benign noise leads to compounding defects, because a process displaying non-random behavior is fundamentally out of statistical control.
“A single outlier demands immediate attention, but an orderly wave of in-spec readings reveals an unmonitored physics variable driving your process.”
Deconstructing Oscillations, Trends, and Multi-Stream Blending
Physical inspection lines rarely produce pure mathematical chaos without external influence. Environmental variables like ambient temperature swings between morning shifts and afternoon heat waves frequently induce rhythmic sinusoidal waves across continuous dimensional plots. When heating jackets cycle or chiller loops ramp down, the process output mirrors the thermal controller frequency. Plotting data against exact timestamps and overlaying secondary environmental sensors instantly clarifies whether the oscillation stems from internal machine parameters or room conditioning units.
Another frequent culprit is multi-stream blending, also called mixture patterns. When parts from two distinct injection mold cavities or automated stamping heads are commingled before the inspection station, the run chart exhibits an unnatural absence of points near the center line. Instead of a bell curve scatter, points bounce between upper and lower Zone B bands without settling near the middle. Disaggregating the sample streams by spindle, cavity, or operator reveals that two stable, tight processes are being improperly lumped into one erratic dataset.
Establishing Reliable Analytical Protocols and Action Thresholds
Responding to non-random patterns requires a structured visual assessment standard. Rather than waiting for automatic software alarms that team members frequently mute, quality teams must audit run charts using standard Western Electric or Nelson rules on active production boards. Cross-functional reviews between manufacturing technicians and quality engineers should treat any run of seven or eight points as an investigative trigger. The first step is never adjusting machine settings impulsively; tampering with an in-control baseline introduces artificial variance that magnifies instability.
Instead, verify physical log sheets against the time of shift onset. Review raw material lot changes, coolant concentration top-ups, and measurement probe calibration logs corresponding to the inflection points. Isolating the root assignable cause turns visual noise into repeatable process intelligence, safeguarding operational baselines across future shifts.
Related Articles
Frequently Asked Questions
In standard Shewhart methodology, eight consecutive readings falling on one side of the center line carries a probability of less than one percent under random variation alone. When eight points cluster together without crossing the mean, statistical software and quality auditors flag this as a non-random shift requiring root-cause documentation rather than ordinary noise.
Cyclical patterns most frequently stem from periodic environmental or mechanical fluctuations. Common drivers include daily ambient factory temperature shifts, automated coolant replenishment cycles, humidity variations between day and night shifts, or periodic mechanical wear on rotating tooling components.
Immediate ad-hoc adjustment often constitutes process tampering. When operators adjust settings based on an unverified pattern without confirming assignable causes, they inadvertently inject additional artificial variation into the system, frequently doubling overall process dispersion.
Key Analytical Takeaways
Systematic trends, alternating point runs, and tight hugs around the mean represent physical forces acting on production, not harmless statistical noise.
Stratified data clustering usually points to combined lots or blended multi-cavity parts that must be isolated and evaluated independently.
Log environmental fluctuations, tooling swaps, and material changeovers at the point of pattern emergence to isolate true drivers without tampering.
Request Analytical Consultation
Inquire directly on statistical baseline validation and review specific parameters of this case.