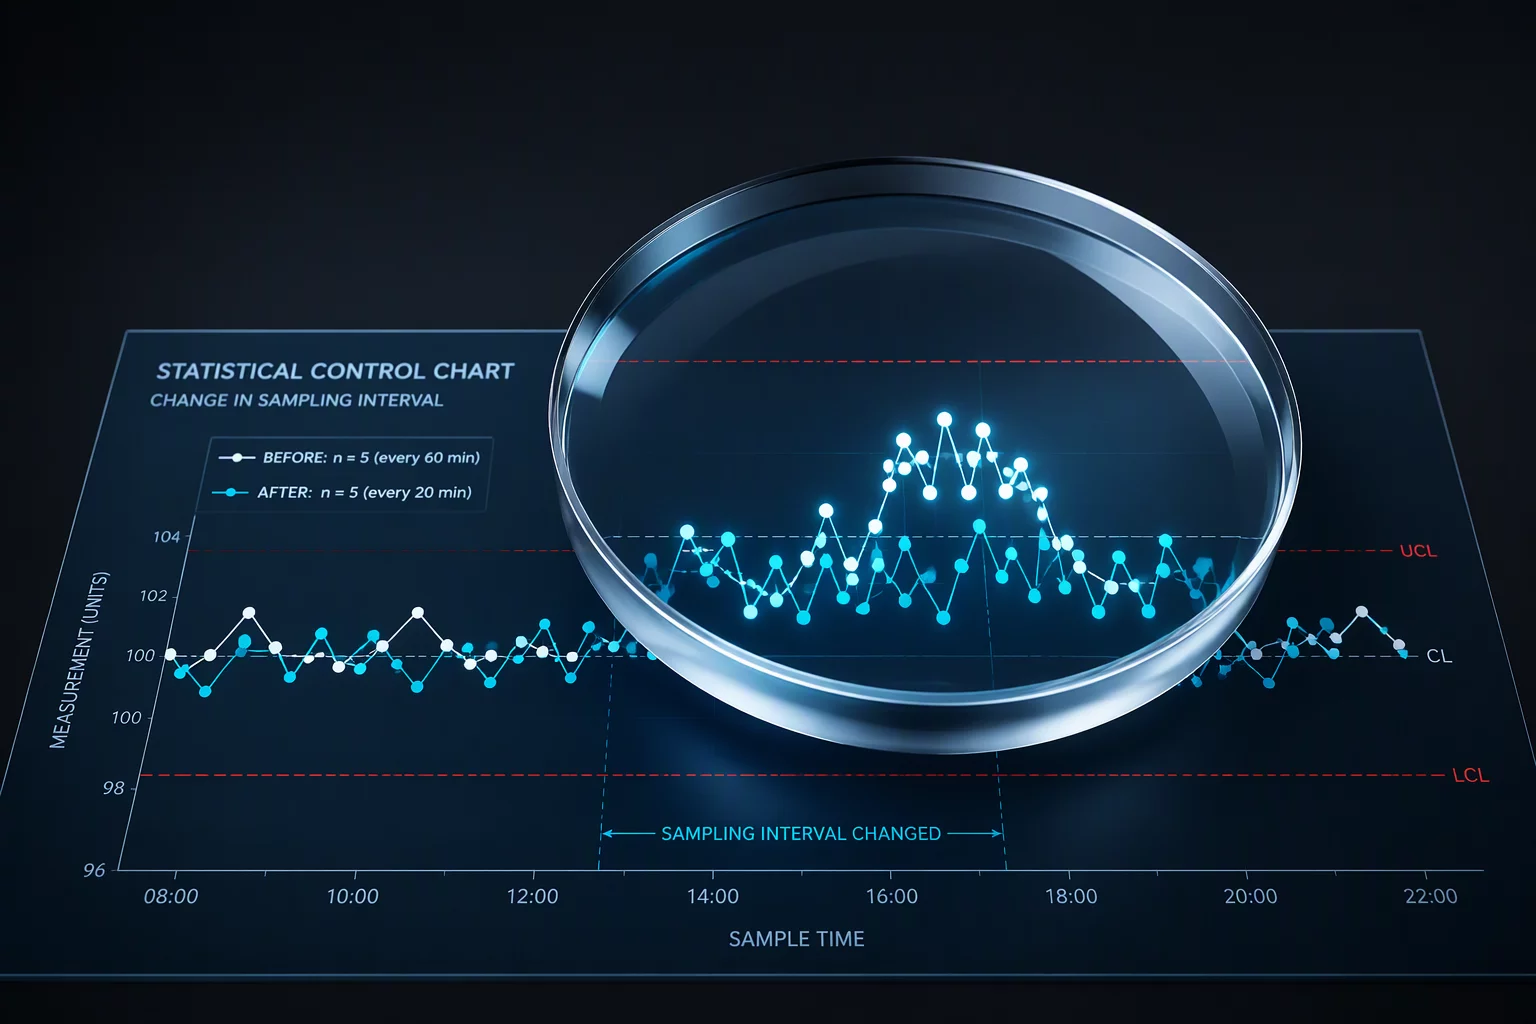
The Deceptive Nature of Altered Sampling Intervals
When a process suddenly exhibits what appears to be severe instability or an unexpected spread in output variance, quality engineers immediately scramble to inspect machinery calibration, incoming raw material lots, and tooling wear.
In numerous plant investigations, however, physical machinery exhibits zero variance while the statistical control chart indicates an alarming disruption. The actual catalyst frequently turns out to be an undocumented change in the sampling protocol itself. Subgroups collected over longer time spans inevitably aggregate piece-to-piece, cycle-to-cycle, and environmental temperature drifts into the within-subgroup variation. What looked like a sudden mechanical breakdown was merely the natural consequence of widening the observation window.
- Increasing subgroup intervals blends batch-to-batch shifts into within-subgroup estimates.
- Pooling parts from multi-cavity molds hides stream-specific offsets while falsely inflating overall range.
- Transitioning from grab samples to composite averages dampens peaks and narrows apparent control limits.
Operators and production managers often make subtle shifts in measurement schedules to balance staffing levels or inspection queue bottlenecks. When inspection teams shift from testing five parts consecutively every twenty minutes to grabbing one piece every half hour, the underlying distribution of the subgroup metrics undergoes an immediate mathematical transformation. The process itself operated consistently throughout both intervals, yet the analytical representation told a conflicting story.
“Before attempting to fix a machine that your charts claim is broken, first confirm that nobody changed the ruler, the cadence, or the bucket size used to measure it.”
Rational Subgroups and the Mechanism of Masking
Walter Shewhart formulated the principle of rational subgrouping specifically to ensure that variation within a subgroup represents only short-term common cause randomness. When teams casually modify subgroup creation—for instance, pulling components across distinct tool spindles or grouping morning and afternoon batches together—between-stream variation contaminates the within-subgroup standard deviation. The resulting control limits widen artificially, masking genuine special-cause signals that would otherwise trigger timely corrective action.
Conversely, switching from composite lot averages to individual sequential measurements will make a previously calm chart appear wildly erratic. Without a standardized baseline log recording the sampling methodology, technical teams waste dozens of hours chasing phantom tool anomalies and tuning operational parameters that were operating within tolerance all along. An uncoordinated sampling adjustment breaks the continuity of the entire historical dataset.
Re-aligning Data Streams and Reconstructing the Baseline
Restoring diagnostic integrity requires segmenting the process history according to measurement protocols before drawing conclusions about physical capability. When historical sampling changes come to light, analysts must partition the control chart, recalculating central lines and control limits strictly for homogeneous sampling periods. Comparing pre-change and post-change performance requires transforming the data back to common mathematical units or recalculating empirical subgroup statistics under matched observation intervals.
Standard operating procedures must enforce that any alteration to sampling frequency, specimen volume, or gage assignment triggers a formal annotation in the quality record. By treating sampling parameters as essential process variables, manufacturing teams safeguard the validity of their statistical windows and prevent unwarranted adjustments to stable industrial machinery.
Related Articles

Frequently Asked Questions
Larger subgroup sizes reduce the standard error of the mean by the square root of n, narrowing the control limits and amplifying chart sensitivity to small mean shifts, while smaller samples broaden the limits and reduce sensitivity.
Yes. Widening the sampling interval captures broader cyclical disturbances, such as diurnal ambient heating or raw material barrel changes, introducing systematic variation into subgroups that mimics special-cause instability.
Partition the control chart at the exact timestamp of the protocol revision, calculate independent control limits for each stage, and avoid calculating capability metrics across the blended regime.
Key Analytical Takeaways
Any alteration to subgroup size or temporal spacing immediately alters within-subgroup dispersion estimates, shifting the mathematical control boundary independently of machine health.
Mixing different sampling protocols within a single baseline invalidates capability indices and obscures genuine physical root causes behind false variance alarms.
Sampling changes must be documented with identical rigor to physical equipment modifications, ensuring historical continuity across statistical surveillance charts.
Request Analytical Consultation
Inquire directly on statistical baseline validation and review specific parameters of this case.