Process Change Comparisons and Net Content Reporting
A systematic engineering protocol for contrasting operating windows, validating filling uniformity, and producing defensible net content documentation across industrial changeovers.
Date: 2026-09-20•Author: Reporting Team•Read Time: 8 min read
Specification Summary
Specification & Regulatory Scope
Primary Analytical Focus
Mean shift detection, standard deviation stability, and container net weight compliance
Statistical Baseline Method
Dual-window Shewhart control bounds with subgroup pooling and two-sample t-test verification
Tolerance & MAV Verification
NIST Handbook 133 maximum allowable variation (MAV) and statistical lot sample limits
Reporting Cadence
Automated shift summaries, lot-close variance matrices, and packaging qualification records
Manufacturing teams regularly adjust nozzle heads, tooling clearances, thermal profiles, and line speeds to improve packaging consistency. Evaluating these adjustments requires separating routine common-cause variability from true structural parameter shifts. When engineers contrast historical baseline windows against active production runs, they must verify whether observed changes stem from genuine process enhancements or temporary sampling noise. Without rigorous subgroup pooling and identical tare measurement protocols, superficial shifts in the sample mean can easily obscure underlying line instability.
Net content compliance introduces strict commercial and statutory constraints where both lot average fills and individual container minimums dictate batch release. When line operators alter filling mechanics, they often observe an apparent gain in throughput while inadvertently increasing filling dispersion. A slight drop in net content standard deviation yields massive reductions in package give-away, whereas an undetected increase in dispersion threatens compliance with maximum allowable variation limits. Clear comparative reporting establishes verifiable evidence that equipment adjustments satisfy engineering targets without breaching packaging regulations.
Consultation Protocol
Calibrate Your Process Verification Protocols
Consult with our quality engineering specialists to establish robust baseline comparison windows, net content confidence bounds, and automated compliance records across production shifts.
Core Summary
Key Principles for Engineering and Compliance Teams
A shift in container fill averages without parallel assessment of standard deviation frequently masks critical increases in filling dispersion.
Comparative baseline windows require strictly identical tare calculation methods, ambient temperature records, and scale calibration schedules.
Regulatory compliance depends upon meeting both the lot average fill mandate and strict tolerances for individual underfill units.
Line modifications require confirmation across at least three continuous operating shifts before baseline control limits are recalculated.
Assessing fill averages without verifying dispersion stability generates misleading compliance reports and conceals serious packaging non-conformance risks.
Engineering Compliance Working Group, VariationWindow Fieldbook
System Execution
System Execution: Comparative Analysis and Audit Reporting
Implementing a defensible process change comparison begins with isolating a verified historical baseline. Teams extract a minimum of twenty-five consecutive subgroups produced under stable operating conditions prior to the maintenance event or engineering adjustment. This baseline represents the reference window against which subsequent production lots are statistically evaluated. Individual measurements within each subgroup must reflect synchronized container tare values to prevent external tare drift from corrupting net weight calculations.
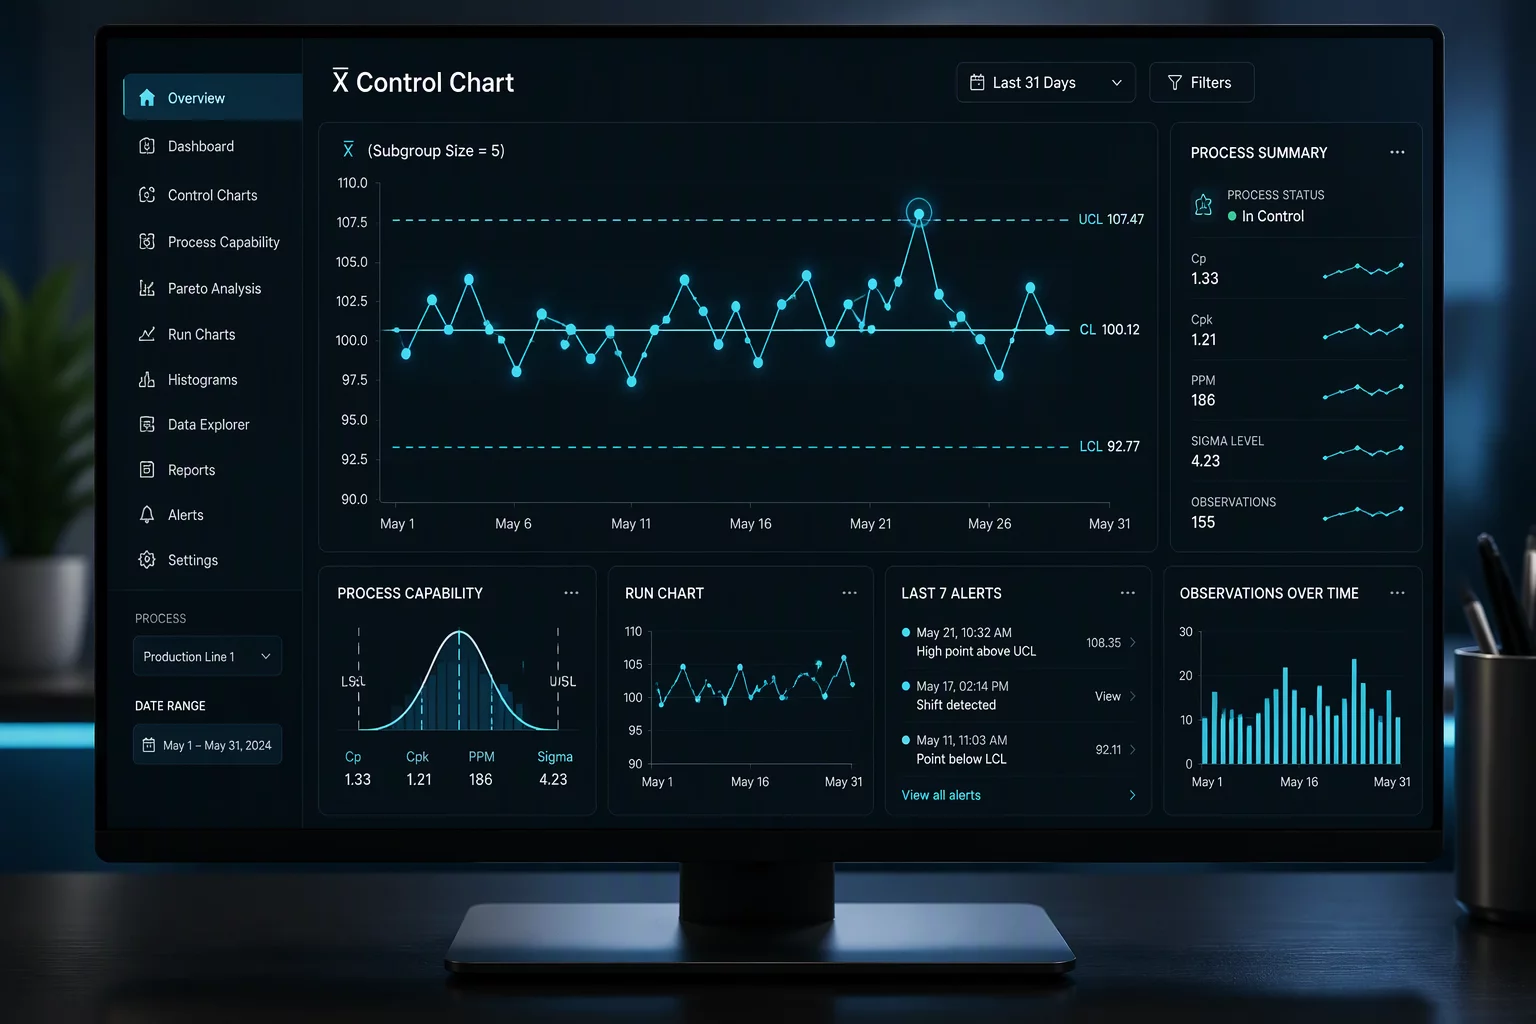
Once the post-adjustment run reaches steady-state operation, the analysis compares the two distributions using pooled variance estimates, two-sample t-statistics, and F-tests for equality of variance. When both the central tendency and dispersion show statistically demonstrable equilibrium, automated reporting modules generate cumulative lot profiles. These profiles map individual sample points against nominal net weight, lower specification limits, and statutory maximum allowable variation thresholds.
Stage 2: Dual-Window Hypothesis Testing: Apply two-sample t-tests alongside variance ratio tests to distinguish genuine process shifts from random within-lot fluctuation.
Stage 3: Net Content & MAV Conformance Check: Audit the post-change distribution against statutory underfill boundaries to confirm that no sample breaches maximum allowable variation limits.
Stage 4: Compliance Documentation Generation: Publish shift comparison matrices, control chart overlays, and capability indices into permanent engineering and regulatory qualification records.
Analytical Evaluation
Analytical Evaluation and Regulatory Margin Analysis
Regulatory frameworks such as NIST Handbook 133 and OIML R 87 stipulate that commercial packaging must satisfy two distinct criteria: the average net quantity of contents in any inspected lot must at least equal the declared quantity, and individual packages must not fall below specified maximum allowable variation limits. When calculating process capability post-modification, engineers must model both constraints simultaneously. A process with an acceptable average fill can still generate severe non-compliance penalties if expanded variability causes even a fraction of containers to cross the minus-MAV boundary.
Continuous net content reporting bridges the gap between shop-floor quality adjustments and formal quality assurance documentation. By archiving before-and-after variance metrics alongside machine configuration metadata, packaging plants create an auditable lineage for every equipment tune-up. This level of rigor eliminates subjective operator adjustments, protects operational margins, and guarantees full compliance during statutory weights and measures inspections.
Related Material
Related Technical Guides
Simulation
Process Simulation Analysis Fundamentals
Explore stochastic process modeling, cycle time distributions, and parameter sensitivity testing for manufacturing lines.