Separating Planned Operational States from Common Cause Variation
Workflow phase tracking in process dashboards addresses one of the most persistent operational hurdles in statistical monitoring: the misinterpretation of scheduled state transitions as process instability. Industrial runs naturally move through varied stages, such as thermal stabilization, recipe dosage adjustments, high-volume production, and scheduled sanitization flushes. When dashboards chart continuous sensory outputs against a static, universal baseline, every planned cycle change produces dramatic spikes that trigger false out-of-control alarms.
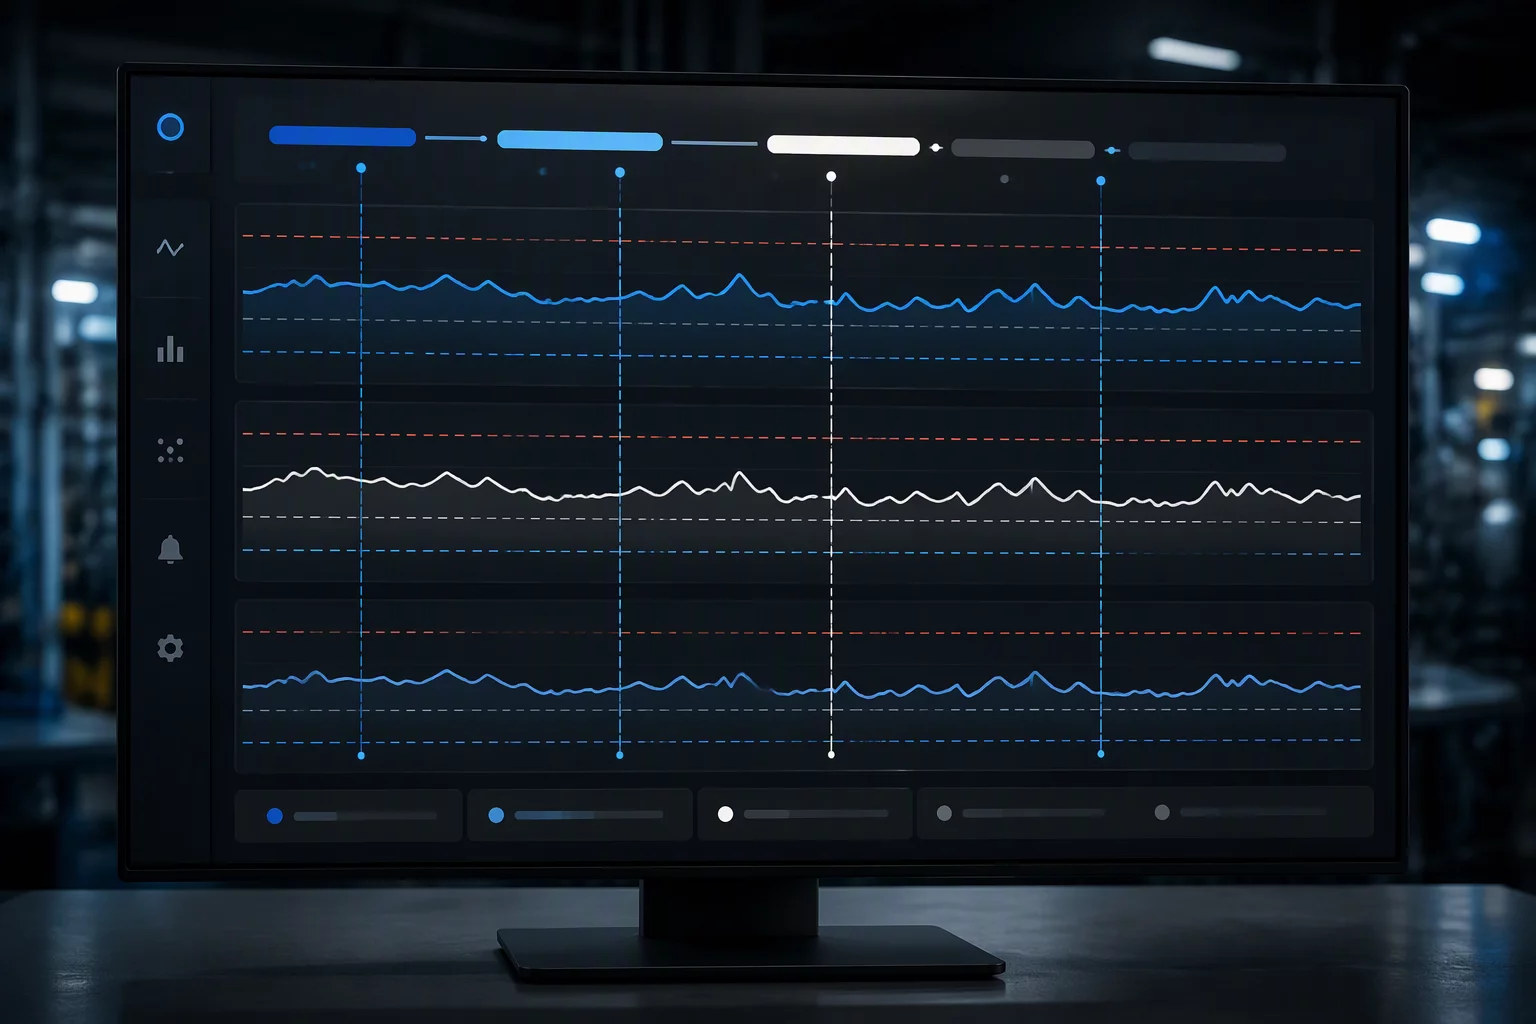
By embedding discrete phase boundaries directly into the telemetry pipeline, modern analytical dashboards isolate the natural dynamics of each processing window. This explicit demarcation ensures that baseline averages, dispersion calculations, and warning thresholds dynamically recalibrate as the equipment crosses state markers. Operators and engineers receive immediate clarity, knowing whether an observed drift originates from an expected cycle shift or genuine process degradation.
Consultation Protocol
Evaluate Phase Tracking Architecture for Your Line
Consult with our analytics specialists to review phase segmentation logic, control limit recalculation triggers, and telemetry synchronization protocols.
Core Summary
Essential Engineering Insights
Universal control limits obscure real shifts by blending distinct processing regimes into a single, artificially wide variance band.
Automated phase demarcation relies on synchronized telemetry flags rather than manual timestamp notations to prevent boundary drift.
Re-anchoring statistical baselines at each stage transition isolates localized special-cause variation within seconds.
Context-aware dashboards prevent operator alarm fatigue by suppressing routine transient spikes during ramp-up cycles.
Without explicit phase demarcation, statistical process dashboards do not reflect true control; they merely illustrate scheduled changes disguised as chaos.
— Industrial Systems Advisory Group, Operational Quality Review 2026
System Execution
System Execution: Configuring Multi-Stage Phase Boundaries
Implementing rigorous phase tracking requires synchronizing programmable logic controller (PLC) state tags with time-series database ingestion. Each cycle transition receives an unequivocal categorical descriptor, establishing when a specific operating regime begins and terminates. The dashboard pipeline processes these discrete state tags, partitioning the incoming stream into localized data windows before calculating subgroup statistics.
During each designated phase, control charts deploy independent centerlines and control limits derived solely from historically verified runs under matching operating conditions. This compartmentalization preserves the sensitivity of Western Electric rules and cumulative sum monitors within the active window, preventing cross-phase contamination while guaranteeing uninterrupted trend surveillance.
Standard Operating Protocol for Phase Segmentation
Phase State Tag Mapping: Assign distinct integer or string flags within the automation controller to mark warm-up, calibration, nominal steady-state, and purge operations.
Dynamic Limit Partitioning: Configure the dashboard engine to calculate separate upper and lower control limits for each stage, displaying vertical splitters across active charts.
Transient Spike Suppression: Establish buffer stabilization timers immediately following state handoffs to filter momentary mechanical settling noise without masking genuine faults.
Analytical Evaluation
Evaluation of Diagnostic Precision and Anomaly Detection
The core merit of phase-delineated tracking lies in its diagnostic precision. In traditional single-window dashboards, broad shifts across formulation changes create inflated standard deviation values, diluting the mathematical power of standard capability metrics. When data streams are split cleanly across designated workflow phases, within-phase variation drops to its true natural level, revealing subtle shifts in process centering that were previously concealed under aggregate noise.
Furthermore, post-run forensic audits benefit enormously from structured phase metadata. Quality analysts can isolate all historical warm-up intervals over a six-month duration to examine whether thermal stabilization times are systematically expanding. Phase tracking transforms a confusing wall of continuous graphs into an indexed, searchable operational archive where each stage tells an intelligible operational story.
Related Material
Related Analytical & Dashboard Field Guides
Simulation
Process Simulation Analysis Fundamentals
Understand core simulation models to stress-test manufacturing parameters before altering physical production schedules.