
Simulation

Process Simulation Analysis Fundamentals
Understand multi-node network modeling to trace operational perturbations and run baseline stress scenarios prior to shop-floor implementation.
Explore cases about stable periods, unusual signals, process changes, baseline windows, and the questions that should come before a conclusion.

Choose the primary operational challenge your team observes in quality run charts to reveal tailored methodology advantages, investigation stages, and reference analysis.
Distinguish random natural fluctuations from assignable structural causes before executing machine parameters recalculation.
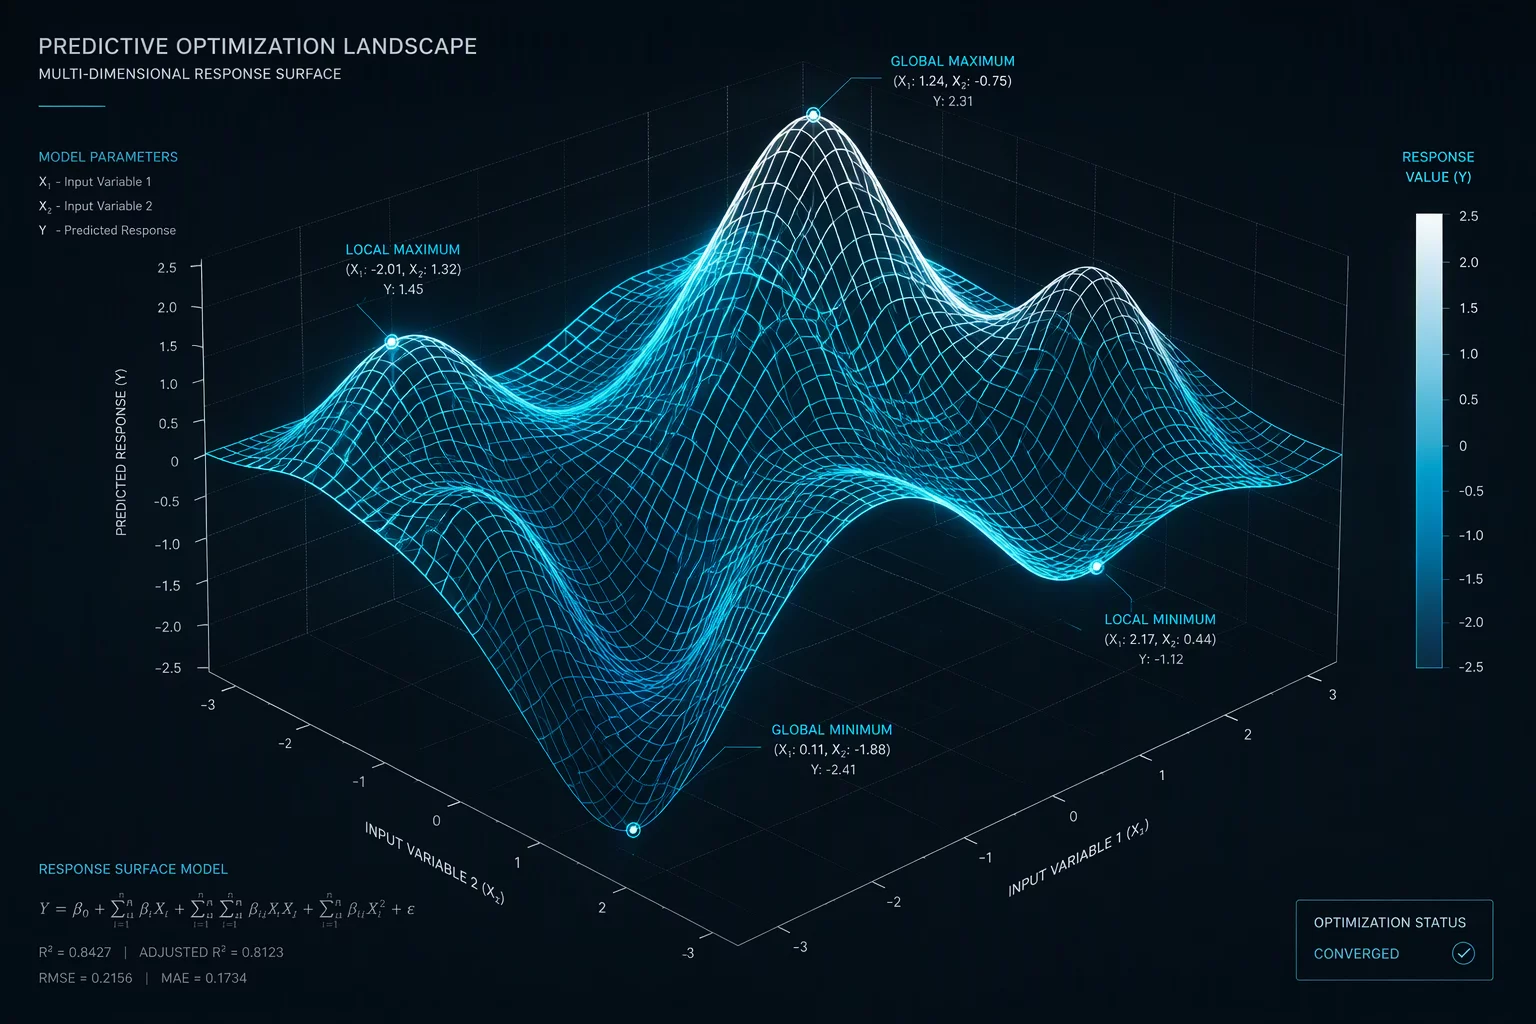
Examine structural variance factors across interacting production parameters to predict stability windows without disrupting line balance.
Evaluating industrial stream variability without disciplined boundaries produces diagnostic confusion, over-adjustment, and recurring process instability.
Treating individual extreme points as operational crises rather than verifying natural process bounds leads to continuous calibration churn.
Relying only on summary averages while undetected variance widens, creating equipment wear and unexplained lot differences.
Blending different tooling changes and material revisions into a single historical baseline, obscuring true operating limits.
Manual machine tuning in response to common variation, which statistically doubles variance and accelerates mechanical instability.
Validating measurements against calculated standard boundaries, isolating routine variation from genuine mechanical anomalies.
Concurrent observation of central location and dispersion consistency, guaranteeing true behavioral control across shifts.
Categorizing timeline subsets by machine state, tooling setup, and vendor supplies to protect baseline diagnostic purity.
Authorizing engineering root-cause reviews strictly on validated signals backed by verifiable operator context logs.
Clear demarcation between statistical diagnostic verification and operational engineering authority prevents divergence before baseline data review begins.
Methodological routines directly executed to isolate variation sources, inspect measurement fidelity, and formalize control thresholds.
Tasks reserved strictly for in-house engineering and production plant staff to uphold plant certification and mechanical safety.
Confirming operating definitions, data sampling intervals, and boundary ownership prior to investigation ensures focused results and objective analysis.
Misinterpreting natural system fluctuations as actionable shifts distorts production control. Recognizing these recurring traps preserves baseline integrity and data validity.
Adjusting machinery or parameters in response to an individual high or low point within natural noise is textbook tampering. This practice inadvertently introduces extra variance, turning a predictable process into an unstable one.
Every deviation from the target represents an assignable malfunction that demands immediate operational intervention.
Evaluate run rules, test for non-random clusters, and verify special-cause signals across a full subgroup window.
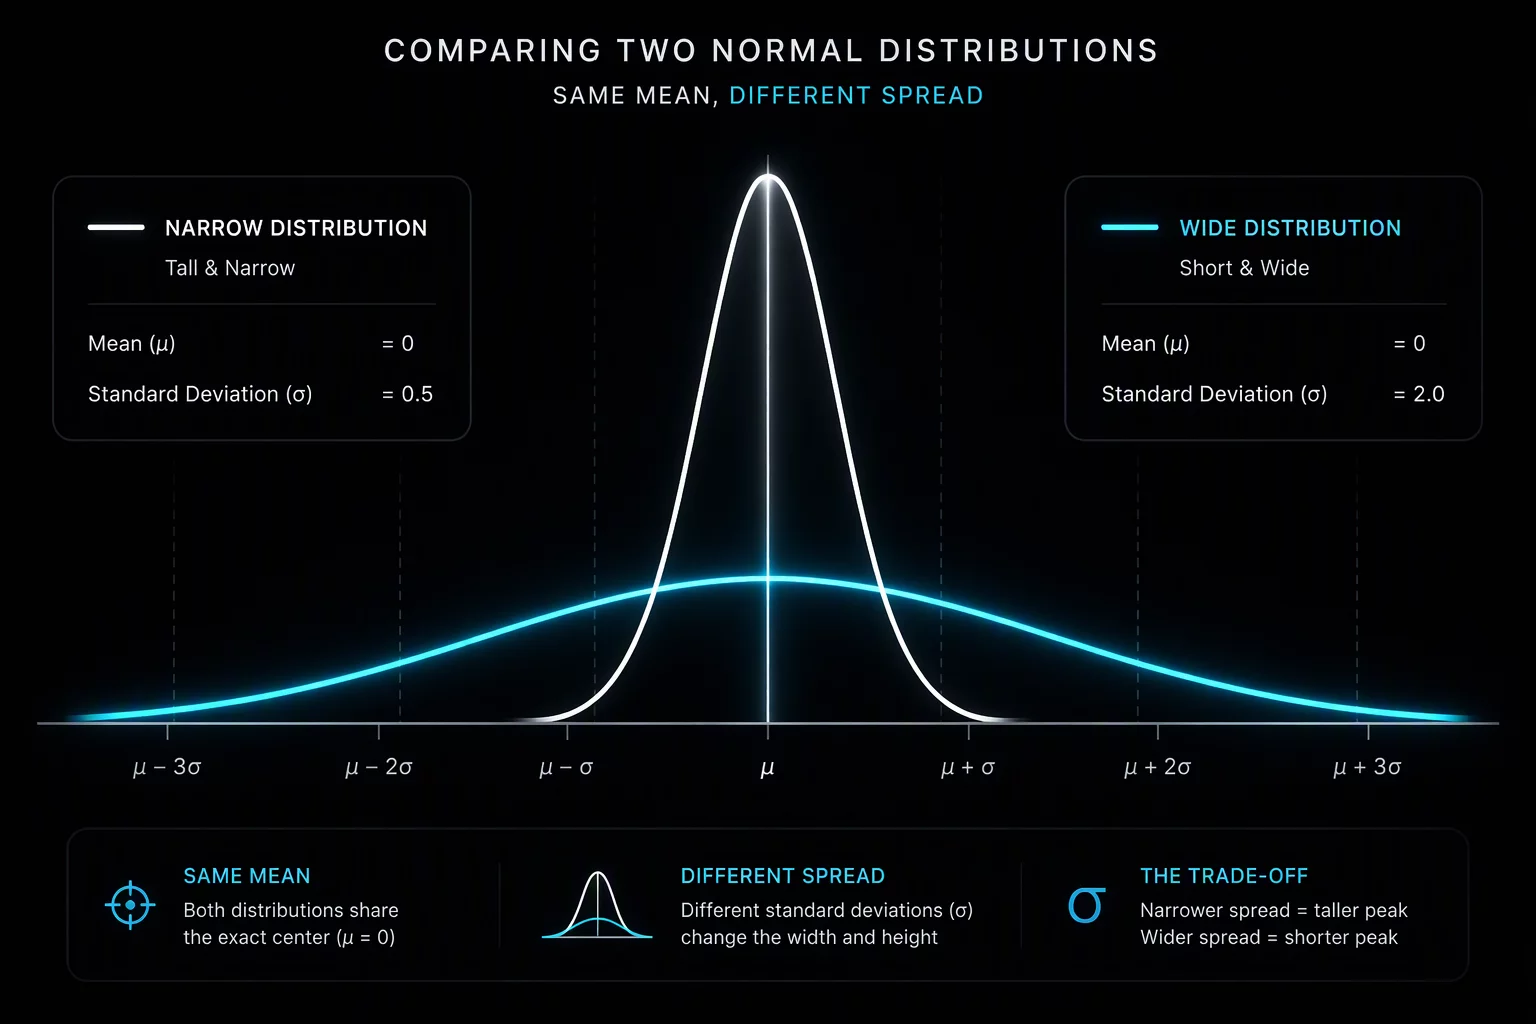
An empirical investigation into an assembly line shift where centered averages masked a sixty percent increase in process spread, detailing real-world data recovery protocols.
Understanding variance requires sequential discipline. Review what parameters, signals, and statistical boundary limits to inspect at each distinct stage before drawing operational conclusions.
Before calculating standard deviations or plotting control lines, you must verify that the measurement system is reliable and that data originates from uniform operating conditions. Combining observations from disparate batch cycles distorts your reference spread.
A process must exhibit statistical control before its capability can be evaluated. At this stage, test points against natural 3-sigma limits to differentiate between common-cause variation and special-cause disruptions.
Only after confirming stability can you compute valid capability metrics. At this evaluation point, compare the natural spread of the data distribution against operational tolerances and target specifications.
When operating parameters are modified, you must compare baseline behavior with subsequent observations. Avoid mistaking normal stochastic variation for genuine operational improvement or degradation.
Practical investigations into process behavior, statistical shift detection, and baseline stability in manufacturing operations.
A common trap in production surveillance: while batch means remained precisely on target, the spread expanded significantly, causing unexpected out-of-tolerance incidents that standard summary averages obscured.

Investigating individual extreme values without checking underlying distribution limits often leads to mistaken machine recalibrations.
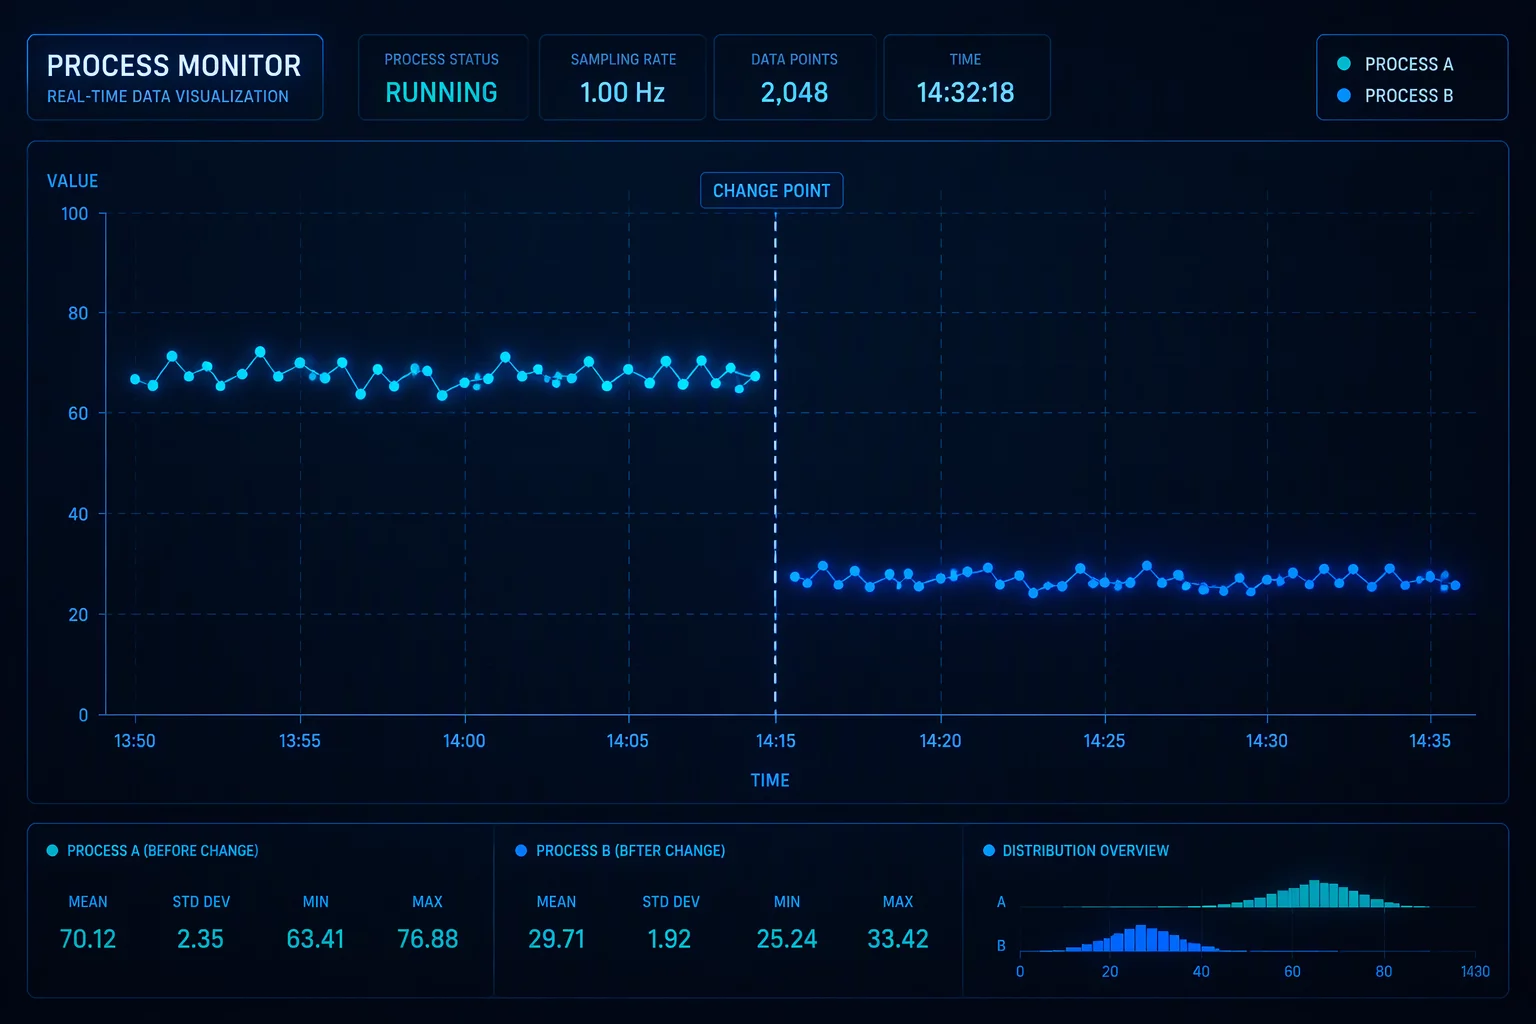
How intentional engineering modifications alter central running levels, requiring updated operational baselines to verify true sustained gains.

Detecting gradual standard deviation degradation over continuous runs when conventional daily averages remain misleadingly constant.
Engineered methods to isolate signal from ambient industrial noise, evaluate stability thresholds, and confirm ongoing process health.
Understand multi-node network modeling to trace operational perturbations and run baseline stress scenarios prior to shop-floor implementation.
Deploy live charting sequences that update boundary metrics continuously without obscuring historic shifts or creating artificial alarms.
Examine computational identification of steady state windows across variable streams to build unbiased baseline bounds.
Convert physical log notes and run parameters into verified computational syntax for systematic dispersion calculation.